
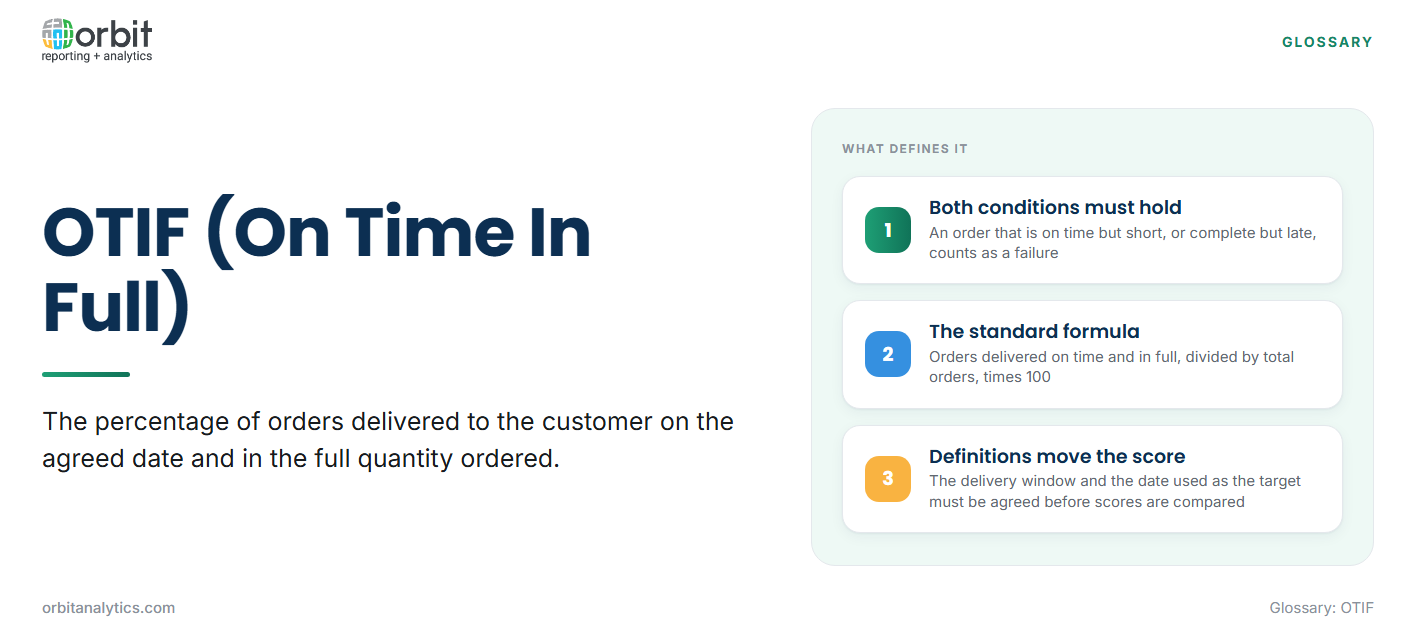
OTIF (On Time In Full) is a delivery performance metric that measures the percentage of orders delivered to the customer on the agreed date and in the full quantity ordered. An order counts as a success only when both conditions hold. An order that arrives on time but short, or complete but late, counts as a failure.
That strictness is the point. A customer who receives 90% of an order on the right day still has a gap on the shelf, and one who receives everything a day late has already had to work around it. OTIF scores each delivery the way the customer experiences it.
Why OTIF Matters
OTIF is a standard measure between suppliers and retailers for three reasons:
- Customer service level in one number: it combines timeliness and completeness into a single figure that sales, operations and customers can all read the same way.
- Retailer compliance and fines: many large retailers set OTIF targets in their supplier agreements and charge penalties when a supplier falls short. Terms differ by contract, so the target that matters is the one written into each customer agreement.
- An early signal of supply chain strain: a falling score often exposes trouble in inventory, warehousing or transport before it reaches revenue.
How to Calculate OTIF
The standard formula is:
OTIF (%) = orders delivered on time and in full ÷ total orders delivered × 100
The calculation can be run at two levels, and the choice changes the result:
| Level | What counts as one unit | Effect on the score |
|---|---|---|
| Order-level | The whole order | One short line fails the entire order, so scores are lower and closer to the customer’s experience |
| Line-level | Each order line | A short line fails only itself, so scores are higher and show which products cause failures |
Neither level is wrong, but the two are not comparable, so the level should always be stated alongside the number.
A common shortcut is to multiply the on-time rate by the in-full rate. That product is not true OTIF. Some orders are both late and short, so the two failure counts overlap, and the product cannot tell which orders failed once and which failed twice. It overstates OTIF when failures fall on different orders, understates it when they cluster on the same orders, and matches only by coincidence.
A Worked OTIF Example
A distributor ships 200 orders in a month. Each order is checked against the agreed delivery date and the ordered quantity:
| Outcome | Orders |
|---|---|
| On time and in full | 164 |
| On time but short | 18 |
| Late but in full | 14 |
| Late and short | 4 |
| Total | 200 |
Counting the failures:
- On time: 164 + 18 = 182 orders, an on-time rate of 182 ÷ 200 = 91%.
- In full: 164 + 14 = 178 orders, an in-full rate of 178 ÷ 200 = 89%.
- Failed at least one condition: 18 + 14 + 4 = 36 orders.
- OTIF: (200 − 36) ÷ 200 × 100 = 164 ÷ 200 × 100 = 82%.
Multiplying the two rates gives 91% × 89% = 81.0%, not 82%. Now suppose the same month had 18 late orders and 22 short orders, with none failing both ways. The rates are unchanged at 91% and 89%, so the shortcut still reports 81.0%, but true OTIF falls to 160 ÷ 200 = 80%. Same two rates, two different scores: only the order-by-order count is reliable.
Defining “On Time” and “In Full”
The definitions often move the score more than operational fixes do, so agree them before comparing scores.
- Delivery windows and tolerances: “on time” may mean the exact day, a time slot, or a window such as one day early to zero days late. Some agreements count early deliveries as failures because they disrupt receiving schedules.
- Requested date vs promised date: measuring against the date the customer asked for is stricter than measuring against the date the supplier confirmed. Using the promised date alone can hide a habit of promising late.
- Partial shipments and substitutions: an order split across two shipments, or filled with an approved substitute, needs a stated rule. Strict definitions fail the order unless the full quantity of the ordered item arrives within the window.
What Lowers OTIF
Most failures trace back to a short list of causes:
- Stockouts and inaccurate inventory: the system shows stock that is not on the shelf, so orders are promised and then shipped short.
- Picking and packing errors: the wrong item or quantity leaves the warehouse, turning a complete order into a short one at the last step.
- Carrier delays: missed pickups, transit delays and failed delivery appointments push orders outside the window.
- Supplier shortfalls: late or short inbound receipts cascade into late or short outbound orders.
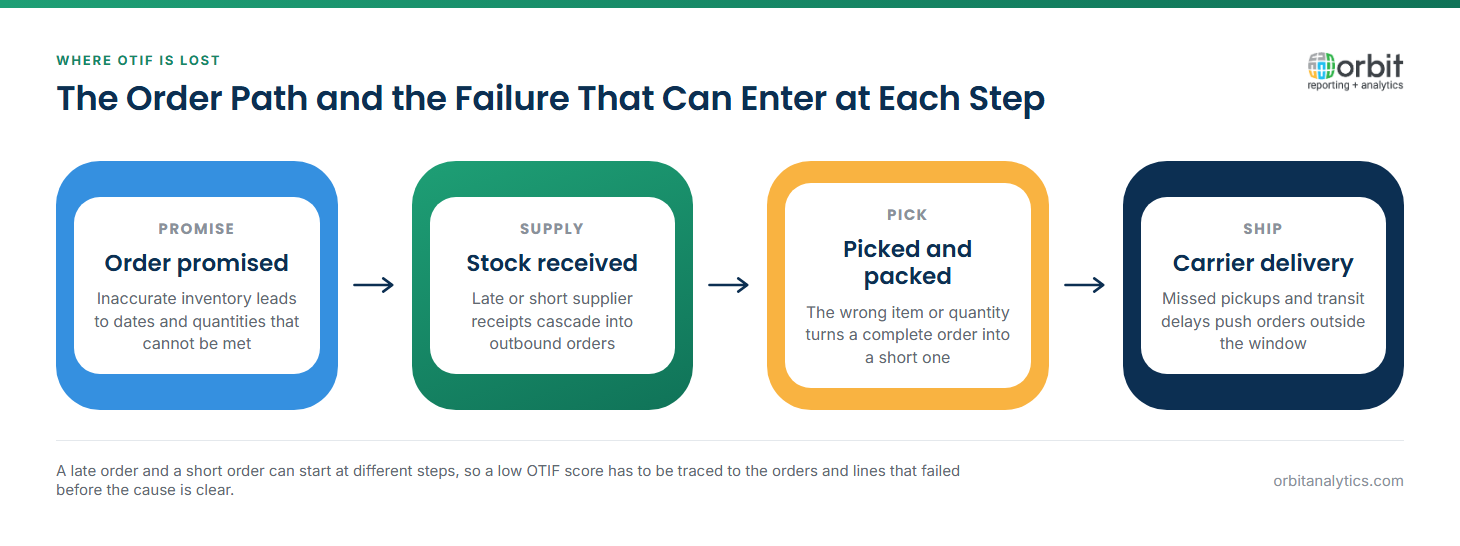
A single percentage does not say which of these is at work. Orbit Analytics lets teams drill from a low OTIF score to the specific orders and lines that failed, and from there to the customer, site or product they have in common, so the cause is found in the transactions rather than guessed from an average.
Measuring OTIF from Oracle ERP Data
The measure needs three records joined correctly: the order with its requested and promised dates, the shipment with its quantity and ship date, and the delivery confirmation with the actual arrival date. In Oracle Fusion Cloud the order side sits in Oracle Cloud Order Management, while Oracle EBS holds the equivalents in its order management and shipping modules.
Partial shipments create many-to-one links between order lines and deliveries. Spreadsheets built on separate exports tend to lose those links, which is how two teams end up reporting different scores for the same month.
Orbit Analytics provides operational reporting that reads order, shipment and receipt data directly from Oracle Fusion Cloud and EBS, so the measure is computed from the transactions rather than from an export. The same score can then be reported by customer, site and product, and placed within wider supply chain reports alongside inventory and supplier performance.
OTIF vs Fill Rate vs On-Time Delivery
The three metrics are often reported together but count different things:
| Metric | What it counts | Question it answers |
|---|---|---|
| OTIF | Orders (or lines) that were both on time and complete | Did the customer get exactly what was ordered, when agreed? |
| Fill rate | Units or lines shipped as a share of those ordered | How much of the demand was met from stock? |
| On-time delivery | Orders delivered within the agreed window, regardless of quantity | Is the delivery schedule reliable? |
Fill rate and on-time delivery are diagnostic: when OTIF falls, they show whether the cause is completeness or timing. OTIF is one of many logistics KPIs supply chain teams track, but it is the one closest to how a customer judges a delivery.
Frequently Asked Questions
Q1. What does OTIF stand for?
OTIF stands for On Time In Full. It measures the share of orders delivered on the agreed date and in the complete quantity ordered.
Q2. What is a good OTIF score?
There is no universal benchmark, because the score depends on the delivery window, the date used and whether it is measured by order or by line. The meaningful target is the one in each customer contract, tracked over time against a fixed definition.
Q3. What is the difference between OTIF and fill rate?
Fill rate measures how much of the ordered quantity was shipped, regardless of timing. OTIF requires each order to be both complete and on time, so it is always the stricter of the two.
Q4. Should OTIF be measured by order or by line?
Order-level OTIF reflects the customer’s experience, because one short line fails the whole order. Line-level OTIF is better for diagnosis, since it shows which products cause failures, so many teams report both and label each clearly.
Q5. Can OTIF be measured for suppliers as well as customers?
Yes. Applied to inbound purchase orders, it measures whether suppliers deliver on the agreed date and in full, using purchase order and receipt records instead of sales orders and shipments.
OTIF is only as reliable as the order and shipment data behind it. Orbit Analytics calculates it from live Oracle Fusion Cloud and EBS transactions, with drill-down to every failed order. Request a demo to see it on your own orders.
