
FINANCE ANALYTICS
One finance picture, whatever ERP it lives in.
Orbit extracts, unifies, and models financial data from every system you run — Oracle Fusion Cloud, E-Business Suite, NetSuite, PeopleSoft and beyond — then lands it in the cloud warehouse and BI tool you already chose. General Ledger through Fixed Assets, prebuilt and KPI-ready.
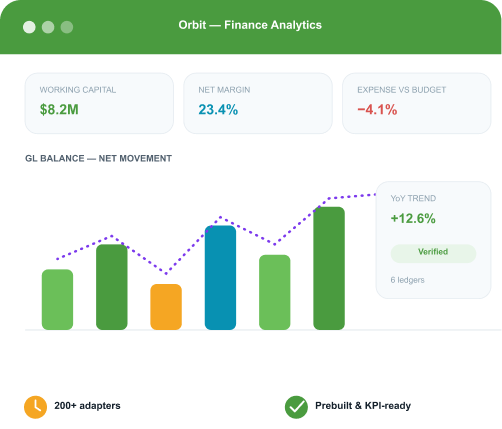
Financial subject areas, modelled and ready to query.
01
General Ledger
BALANCES · RATIOS · TREND
Centralised GL balances across ledgers and applications — beginning and closing balances by debit and credit, period net movement, and year-over-year trend without hand-built pivot files.
›Revenue & Expense›Gross & Net Margin›Expense vs. Budget›ROE · ROA›Working Capital›Balance by Ledger


02
Accounts Payable
SUPPLIER · CYCLE TIME · HOLDS
What is overdue, what is waiting on approval, and where cycle time is being lost across a diverse supplier base. Payment patterns feed cash forecasting instead of sitting in a static aging report.
›Paid vs. Invoice Amount›Payments Due›Average Cycle Time›Top Suppliers by Hold Days›Late / Early / On-Time›Awaiting Approval
03
Accounts Receivable
AGING · COLLECTIONS · CREDIT
Aging summarised by due date so collections effort goes where it recovers the most cash. Customer payment behaviour and credit exposure tracked as trends, not a month-end snapshot.
›Overdue / Current / Future›Average aging Days›Total rReceivables›Top Customers by Receipt Delay›Days Overdue by Customer


04
Cash Management
POSITION · INFLOW · OUTFLOW
The overall cash position by month, with inflows and outflows attributed to the customers and suppliers driving them — so every movement has an explanation attached.
›Total Cash Flow›Position by Month›Inflow / Outflow›Top Customers — Inflow›Top Suppliers — Outflow
05
Fixed Assets
COST BASIS · RETIREMENT · CATEGORY
Original, current, recoverable and salvage cost organised by asset category and book type, with forward-looking retirement schedules so disposals are planned rather than discovered at close.
›Asset Count›Original & Current cost›Units in Service›Retiring in 7 / 30 / 60 Days›Retirement & Removal Cost

Finance rarely stops at finance.
The same modelled layer covers Procurement, Inventory, Projects, Grants Management and HCM — so spend commitments, project cost and revenue, award budget balances and workforce cost join to the GL without a second integration project.

