
ENTERPRISE SUPPLY CHAIN ANALYTICS
From requisition to shelf, one continuous picture.
Orbit extracts, unifies, and models procurement and inventory data from every system you run — Oracle Fusion Cloud, E-Business Suite, NetSuite, PeopleSoft and beyond — then lands it in the cloud warehouse and BI tool you already chose. Purchase orders through expiry aging, prebuilt and KPI-ready.
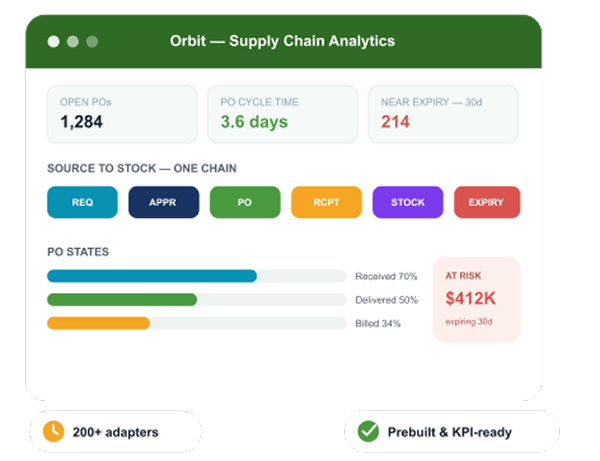
Subject areas that follow the order, not the org chart
01 REQUISITION→02 APPROVAL→03 PURCHASE ORDER→04 RECEIPT→05 ON HAND→06 EXPIRY
One chain, a prebuilt KPI set at every stage.
01
Requisitions & Approvals
STAGES 01–02 · INTAKE
Where demand enters and where it stalls. Approved and rejected requisition volumes with the approval workflow timed end to end, so a slow buyer or an absent approver shows up as a number instead of an anecdote.
›Approved Requisitions›Rejected Requisitions›Requisitions by Supplier›Approval Workflow Status


02
Purchase Orders
STAGE 03 · COMMITMENT
Open, closed and incomplete POs with approval cycle time attributed to the buyer who owns them. Monthly movement is tracked across every state an order passes through, so the gap between ordered and received is visible while it can still be closed.
›Open / Closed / Incomplete POS›Average PO Approval Cycle Time›Cycle Time by Buyer›Ordered · Accepted · Cancelled›Received · Shipped · Delivered · Billed›Top Items by Ordered amount
03
Suppliers & Agreements
STAGES 03–04 · PERFORMANCE
Supplier performance ranked by spend and by behaviour — PO volume, hold days, agreement utilisation — plus how long an agreement takes to get from creation to approval, which is often the real constraint on sourcing speed.
›Top Suppliers by PO Amount›Top Suppliers by Hold Days›Agreements by Supplier & Month›Agreement Creation-to-Approval Days›Supplier Payment Cycle Time


04
Inventory & Stock Position
STAGE 05 · ON HAND
Consolidated visibility across every inventory organisation: what is on hand, what is actually available, and what is already reserved — measured against minimum and maximum stock levels rather than reported as a raw count.
›Inventory Organisations›Inventory Items›Quantity on Hand / Available / Reserved›Items Over Stock Level›Items Under Stock Level›Lot & Serial Controlled Items
05
Expiry, Aging & Cost
STAGE 06 · WRITE-OFF RISK
The stock that is quietly becoming a write-off. Near-expiry items surfaced at 30 and 60 days with shelf-life and maturity aging, and transaction cost traced by lot, serial, item and source so the loss has an owner.
›Expired Items›Near Expiry — 30 / 60 Days›Items by Maturity & Shelf Days›Expiring Transaction Aging›Cost by Lot / Serial / Item›Cost by Transaction Source

The chain does not end at the receipt.
The same modelled layer covers Accounts Payable, General Ledger, Projects and Grants Management — so committed spend reconciles to the GL, supplier invoices join to the POs that raised them, and project material cost lands against the project that consumed it.

