
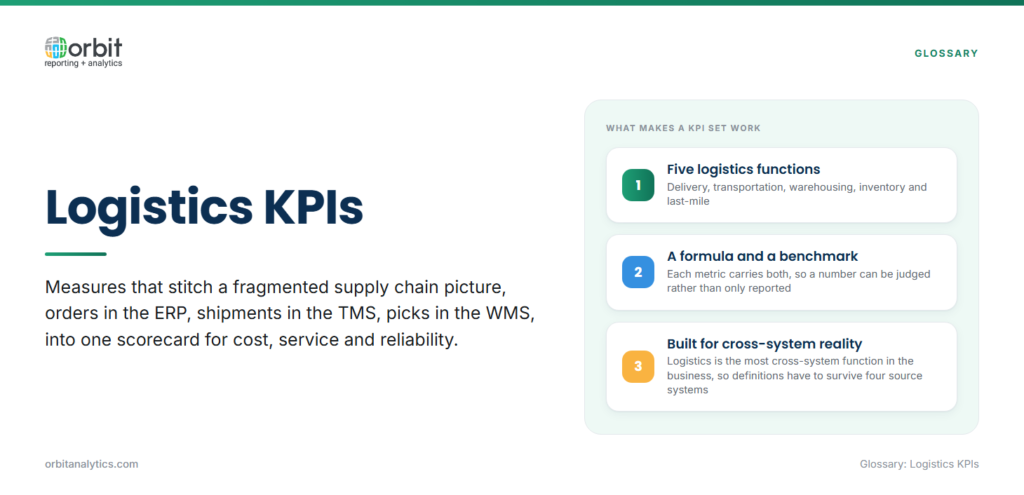
Supply chain managers run the most cross-system function in the business. Orders sit in the ERP, shipments in the TMS, picks in the WMS, and carriers report back through portals. The right logistics KPIs stitch that fragmented picture into one scorecard for cost, service, and reliability.
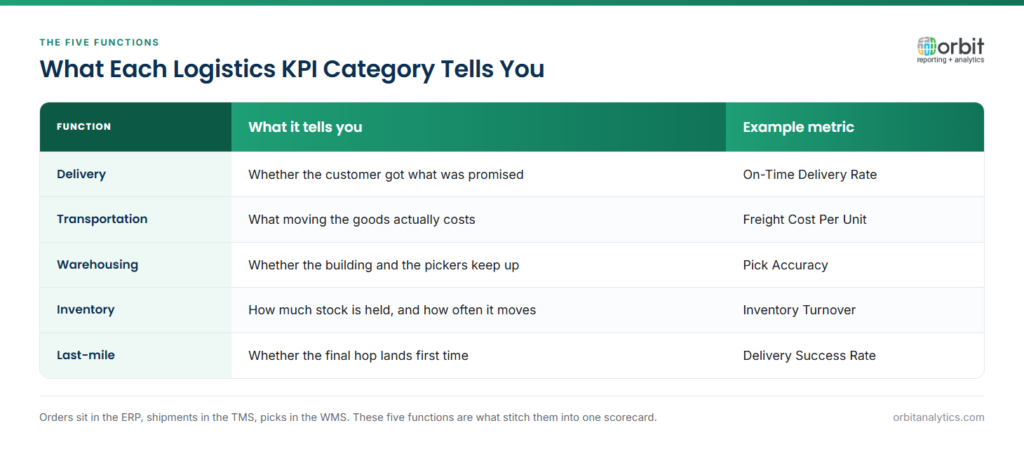
This guide lists 25 KPIs organized by logistics function: delivery, transportation, warehousing, inventory, and last-mile. Each entry includes the formula, a working benchmark, and a one-line reason it matters.
Why Do Logistics KPIs Matter?
Logistics is where service level and cost trade off directly, and small process gaps compound into large customer impact. A two-point drop in on-time delivery hits NPS within weeks; a 5% rise in freight cost per unit erases margin without anyone noticing. Logistics KPIs make those moves visible while they are still small.
Quick Reference: Top Logistics KPIs by Category
| Category | KPI | Formula or Definition | Benchmark |
| Delivery | On-Time Delivery Rate | On-Time / Total Deliveries x 100 | 98%+ excellent |
| Delivery | Perfect Order Rate | Perfect Orders / Total Orders x 100 | 95%+ excellent |
| Delivery | Order Accuracy | Correct Items / Total Orders x 100 | 99.5%+ excellent |
| Transportation | Freight Cost Per Unit | Total Freight Cost / Units Shipped | Track trend |
| Transportation | Fleet Utilization | Used Capacity / Available x 100 | 80%+ |
| Transportation | Carrier Performance Score | Composite reliability rating | Track trend |
| Warehousing | Warehouse Capacity Utilization | Used Space / Total Space x 100 | 80-90% |
| Warehousing | Pick Accuracy | Correct Picks / Total Picks x 100 | 99.9%+ excellent |
| Inventory | Inventory Turnover | COGS / Average Inventory | 6-12x (varies) |
| Inventory | Stockout Rate | Stockout Events / SKU Periods | <5% |
| Last-Mile | Delivery Success Rate | First-Attempt / Total x 100 | 95%+ excellent |
| Last-Mile | Returns Processing Time | Avg days to resolve | <5 days |
Delivery Performance KPIs
- 1. On-Time Delivery Rate: (On-Time Deliveries / Total Deliveries) x 100. Benchmark: 95% good, 98%+ excellent. The customer-facing reliability score.
- 2. Perfect Order Rate: (Perfect Orders / Total Orders) x 100. Benchmark: 90% good, 95%+ excellent. Captures the full customer experience, on time, complete, accurate, undamaged.
- 3. Order Accuracy Rate: (Correct Items Shipped / Total Orders) x 100. Benchmark: 98% good, 99.5%+ excellent. Tests warehouse and system data quality together.
- 4. Delivery Lead Time: Order placement to delivery duration. Benchmark: track trend; faster is better. Customer-facing speed metric.
- 5. Customer Delivery Satisfaction: Average customer rating on delivery experience. Benchmark: program-specific; target 4.5/5 or higher. Closes the loop between operations and customer perception.
Transportation KPIs
- 6. Freight Cost Per Unit: Total Freight Cost / Units Shipped. Benchmark: track trend. Core efficiency metric for shipping spend.
- 7. Freight Cost as Percentage of Sales: (Freight Cost / Revenue) x 100. Benchmark: industry-specific. Tests whether shipping is scaling with business or eating into margin.
- 8. Transportation Cost Per Mile: Total Transport Cost / Miles Traveled. Benchmark: track trend by lane. Route and carrier efficiency at the network level.
- 9. Fleet Utilization Rate: (Used Capacity / Available Capacity) x 100. Benchmark: 80%+. Identifies underused trucks and load-planning gaps.
- 10. Average Transit Time: Mean shipment duration from origin to destination. Benchmark: lane-specific. Service-level baseline for carrier scorecards.
- 11. Carrier Performance Score: Composite of on-time %, damage rate, billing accuracy. Benchmark: track and rank. Anchors quarterly carrier reviews.
Warehousing KPIs
- 12. Warehouse Capacity Utilization: (Used Space / Total Space) x 100. Benchmark: 80-90%. Flags expansion needs and inefficient slotting.
- 13. Pick and Pack Accuracy: (Correct Picks / Total Picks) x 100. Benchmark: 99% good, 99.9%+ excellent. Single largest driver of order accuracy downstream.
- 14. Order Picking Productivity: Orders Picked / Labor Hour. Benchmark: track trend. Direct measure of warehouse labor efficiency.
- 15. Receiving Efficiency: Time to process incoming goods from arrival to put-away ready. Benchmark: track trend. Front-end throughput of the warehouse.
- 16. Put-Away Time: Duration to store received inventory in its location. Benchmark: <2 hours from receipt. Holds inventory accuracy and pickable stock together.
Inventory Management KPIs
- 17. Inventory Turnover Rate: COGS / Average Inventory. Benchmark: 6-12x annually depending on industry. Capital efficiency and demand match.
- 18. Inventory Accuracy: (Matched Items / Total Items) x 100. Benchmark: 95% good, 99%+ excellent. Planning is only as good as the count.
- 19. Stockout Rate: Stockout Events / SKU Periods x 100. Benchmark: <5%. Direct service-level risk.
- 20. Days of Inventory On Hand: (Average Inventory / COGS) x 365. Benchmark: industry-specific; lower is better. Cash tied up in stock.
- 21. Carrying Cost of Inventory: (Holding Cost / Average Inventory Value) x 100. Benchmark: 20-25% annually. True cost of holding stock including capital, space, and obsolescence.
Last-Mile Delivery KPIs
- 22. Last-Mile Delivery Cost: Total Last-Mile Cost / Final-Leg Deliveries. Benchmark: track trend. Where most shipping spend now sits in e-commerce networks.
- 23. Delivery Attempt Success Rate: (First-Attempt Successes / Total) x 100. Benchmark: 90% good, 95%+ excellent. Cost and CX driver in one metric.
- 24. Returns Processing Time: Average days from return receipt to resolution. Benchmark: <5 days. Customer satisfaction and reverse-logistics efficiency.
- 25. Proof of Delivery Rate: (Confirmed Deliveries / Total Deliveries) x 100. Benchmark: 99%+. Reduces disputes and chargebacks.
How Do You Choose the Right Logistics KPIs?
Start from the supply chain strategy. A cost-leader network weights freight cost per unit and warehouse utilization; a service-leader network weights perfect order rate and delivery success rate. Always balance cost and service metrics, optimizing one in isolation breaks the other. Logistics KPIs also live or die on data integration: if TMS, WMS, and ERP data cannot be joined, your scorecard will always be a week late and a million dollars off. Orbit Analytics provides Oracle EBS reporting and pre-built connectors that join order, shipment, and cost data into one model, so logistics KPIs refresh on the same cadence as finance numbers.
What Are Best Practices for Logistics KPI Tracking?
Unify data across systems first, fragmented dashboards produce arguments about whose number is right, not decisions. Monitor headline KPIs in real time where data supports it, and set exception alerts so red metrics route to owners. Orbit Analytics delivers business intelligence dashboards that unify TMS, WMS, and Oracle ERP data, with drill-down to the order, shipment, and SKU level. Pair that with the data pipeline for change-data-capture refreshes when volume outgrows nightly batches.
Frequently Asked Questions
Q1. What is the most important KPI in logistics?
Perfect Order Rate is the most cited because it captures on-time, complete, undamaged, and correctly invoiced in a single number. Many supply chain teams pair it with freight cost per unit so service and cost are tracked together.
Q2. What is on-time delivery rate and how is it calculated?
On-Time Delivery Rate is the percentage of orders delivered on or before the promised date. It equals on-time deliveries divided by total deliveries, multiplied by 100. Definitions matter, some teams count receiver confirmed dates, others count carrier scans, and the gap can be five percentage points.
Q3. What is perfect order rate?
Perfect Order Rate is the percentage of orders delivered on time, complete, without damage, and with an accurate invoice. It is the holistic customer-experience metric. World-class operations are at 95%+; many networks sit at 80-85% and do not realize because the components are tracked separately.
Q4. What is a good on-time delivery rate?
95% is considered good; 98% and above is excellent. Below 90% usually points to systemic issues in promised-date setting, carrier reliability, or warehouse cut-off times rather than execution effort.
Q5. How do logistics KPIs help reduce costs?
They expose where service and cost trade off badly, freight overspend on lanes that don’t need premium service, expedited shipping caused by poor demand planning, dead inventory tying up capital. Without KPIs those costs hide inside aggregate numbers. With them, they become specific projects with owners.
Q6. How often should logistics KPIs be reviewed?
Delivery performance and freight cost are reviewed weekly in operations meetings. Carrier scorecards are reviewed monthly or quarterly. Inventory turnover and carrying cost fit a monthly cadence aligned with management reporting.
Ready to track these logistics KPIs against your Oracle ERP, TMS, and WMS data? Request a demo to see how Orbit Analytics delivers unified supply chain dashboards on top of Oracle Fusion Cloud and EBS.
