
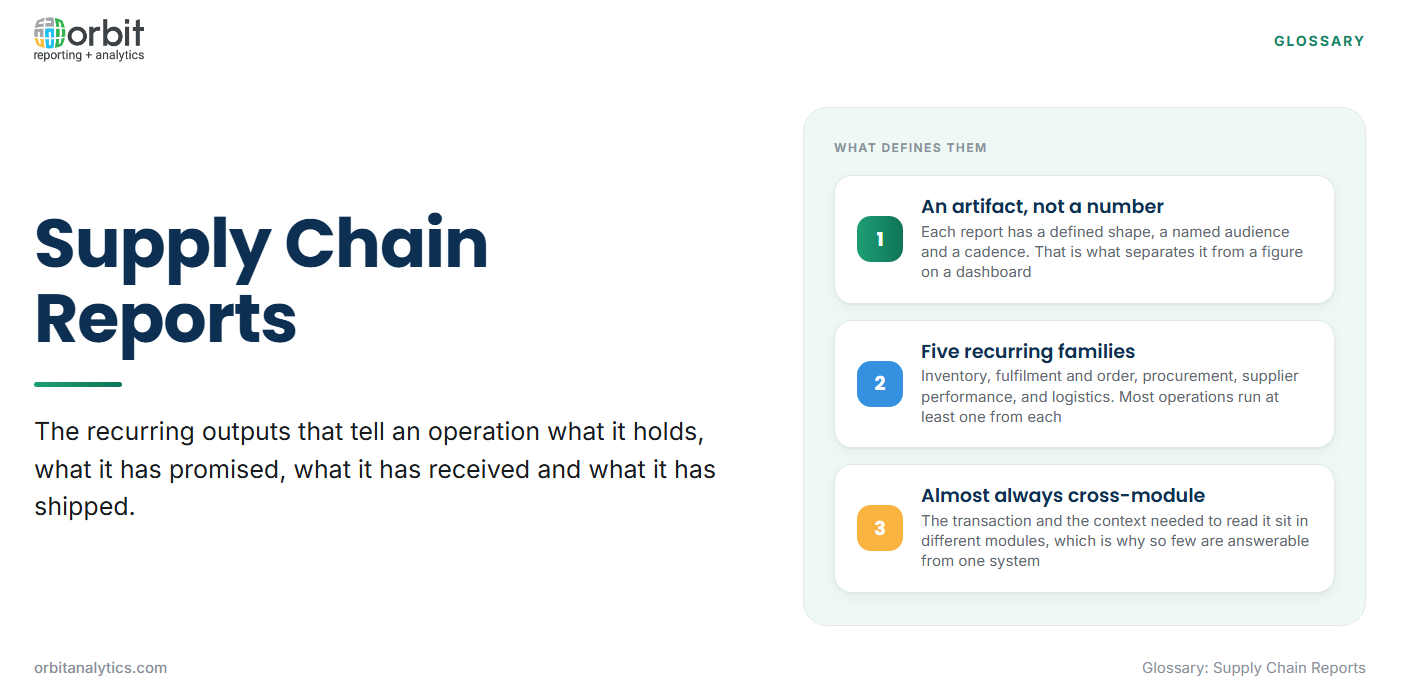
Supply chain reports are the recurring outputs that tell an operation what it holds, what it has promised, what it has received and what it has shipped. Each one is an artifact with a defined shape, a named audience and a cadence, which is what separates a report from a number on a dashboard.
The distinction is worth holding onto, because the two get conflated constantly. A metric summarises; a report is what somebody actually works from. A warehouse manager does not act on an inventory accuracy percentage. They act on the list of items whose counted quantity disagrees with the system, which is a report.
Inventory Reports
Inventory reporting answers what is held, where, and in what condition. Three forms carry most of the weight.
- Stock on hand: Quantities by item and location, usually as of a stated moment. It is the report most often disputed, because “on hand” can mean physically present, available to promise, or unreserved, and the three differ.
- Inventory ageing: Stock grouped by how long it has been held, which surfaces slow-moving and obsolete lines before they become a write-down.
- Cycle count and adjustment: Counted quantities against system quantities, with the resulting adjustments. This is the audit trail behind any claim about inventory accuracy.
Fulfilment and Order Reports
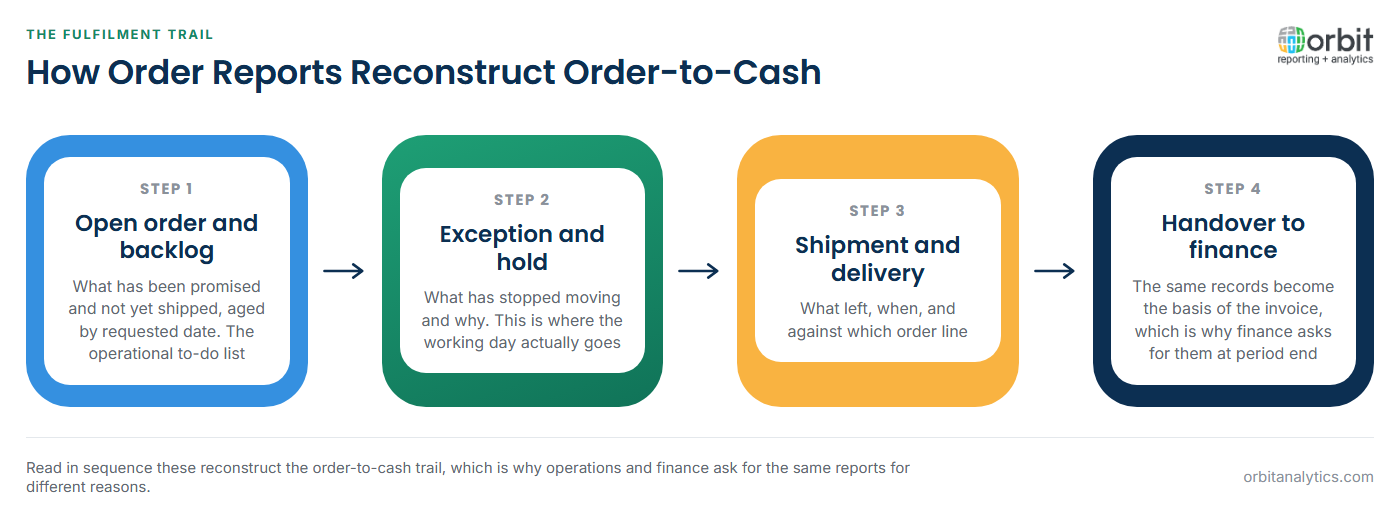
These follow a customer promise from acceptance to delivery, and they form a continuous trail rather than a set of independent outputs.
- Open order and backlog reports list what has been promised and not yet shipped, aged by requested date. This is the operational to-do list.
- Shipment and delivery reports record what left, when, and against which order line.
- Order exception and hold reports list what has stopped moving and why, which is where the working day actually goes.
Read in sequence they reconstruct the order-to-cash trail, which is also why finance asks for them at period end.
Procurement and Purchasing Reports
The inbound mirror of the fulfilment set: open purchase orders, receipts and three-way match exceptions, and spend analysed by category and supplier. These reports sit on the boundary between operations and finance, since the same receipt that closes a purchase order also creates an accrual. The discipline itself is covered in procurement reporting.
Supplier Performance Reports
Supplier reporting measures whether suppliers did what they agreed: delivery against the promised date and quantity, quality and rejection rates, and lead time variance against the agreed term.
This is the hardest group to automate, for a reason that has nothing to do with tooling. Much of the evidence is not in the ERP. Carrier timestamps, inspection results and supplier-side commitments live in other systems or in email, so the report is only as honest as the data that was captured at the time. Teams that produce credible supplier reporting have usually solved a capture problem first.
Logistics and Transportation Reports
Freight cost by lane and carrier, in-transit and exception reporting, and warehouse throughput. The recurring difficulty here is that the carrier knows things the ERP does not, including where a shipment currently is, so a logistics report is frequently the merger of an internal record with an external feed rather than a query against one system.
Where the Data Comes From in an Oracle Estate
Supply chain data is produced by several modules and consumed as though it came from one.
| Report family | Produced mainly by | Also needs |
| Inventory | Inventory management | Costing, purchasing |
| Fulfilment | Order management | Inventory, shipping |
| Procurement | Purchasing and payables | Inventory receipts |
| Supplier performance | Purchasing | Quality, external carrier data |
| Logistics | Shipping and transportation | Carrier systems, costing |
Nothing in the right-hand column is optional, which is why almost no useful supply chain report can be answered from a single module. Two further complications follow. Analytical queries against a live ERP compete with the people transacting in it, and a cloud migration rarely brings the old system’s history with it, so year-on-year comparison breaks at the cutover. Orbit Analytics reports across Oracle Fusion and EBS data in one model, which is what keeps a multi-module report from becoming a manual merge.
How These Reports Get Built and Distributed
Four routes cover most of what exists in practice.
- Standard reports shipped with the ERP: Available immediately, rigid in layout, and usually scoped to one module.
- Extracts into spreadsheets: The most common and least governed route. It works, and it breaks the moment two people extract on different days.
- Scheduled and bursted distribution: One report generated once and split by recipient, so each site or buyer receives only its own rows.
- Self-service against a governed model: Users build their own views on a shared definition of each measure, which is the only route that scales without multiplying versions.
The choice is less about capability than about how many versions of a number an organization is willing to have. Orbit Analytics covers the last two routes from one governed model, so a bursted distribution and a self-service view resolve to the same definition. Distribution is covered further in operational reporting.
Supply Chain Reports vs. Supply Chain Metrics
The two are routinely used as if they were the same thing, and treating them as interchangeable is what produces dashboards nobody acts on.
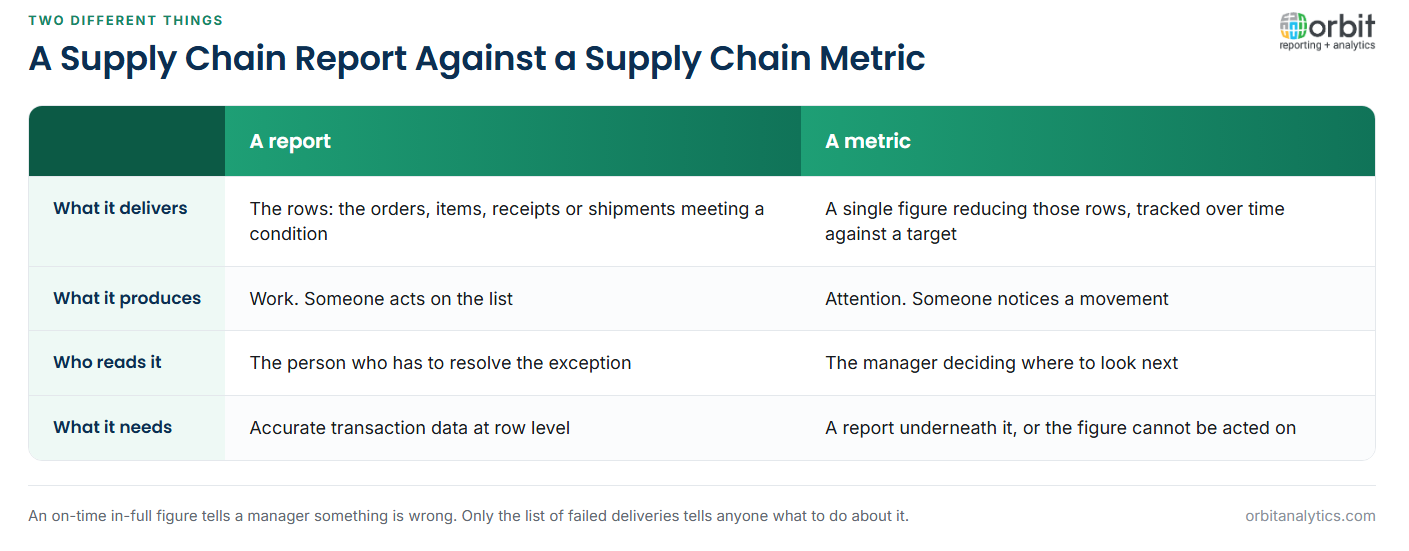
A report delivers rows. It lists the orders, items, receipts or shipments that meet some condition, at a stated moment, for a named audience. Its output is work.
A metric measures. It reduces those rows to a single figure that can be tracked over time and compared against a target. Its output is attention. The common measures are covered in logistics KPIs.
Every credible metric has a report behind it. An on-time in-full figure is meaningless without the list of deliveries that failed, because the figure tells a manager that something is wrong and only the list tells anyone what to do. When a supply chain reporting programme stalls, it is usually because it built the figures and never built the lists underneath them.
Frequently Asked Questions
Q1. What are supply chain reports?
They are the recurring outputs that tell an operation what it holds, what it has promised, what it has received and what it has shipped. Each has a defined shape, an audience and a cadence.
Q2. What are the main types of supply chain report?
Inventory, fulfilment and order, procurement and purchasing, supplier performance, and logistics and transportation. Most operations run at least one report from each group.
Q3. What is the difference between a supply chain report and a supply chain KPI?
A report lists the underlying rows and produces work. A KPI reduces those rows to a single tracked figure and produces attention. Every useful KPI has a report behind it.
Q4. Why does one supply chain report span several modules?
Because the transaction that creates the data and the context needed to interpret it are usually recorded in different modules. A fulfilment report needs order data, inventory positions and shipping records at once.
Q5. Why is supplier performance reporting so hard to automate?
Because much of the evidence sits outside the ERP, in carrier systems, inspection records or correspondence. The report is only as reliable as what was captured when the event happened.
Q6. What happens to supply chain reporting history after a cloud migration?
It frequently does not travel. Unless history is deliberately retained in a reporting layer, year-on-year comparison breaks at the cutover and the first year after a migration has nothing to compare against.
A supply chain report is only as good as its ability to reach across the modules that produced it, which is exactly where most reporting stops. Orbit Analytics reports live across Oracle inventory, order management and purchasing data with drill-down from any line to its transaction. Request a demo to see it against your own operation.
