
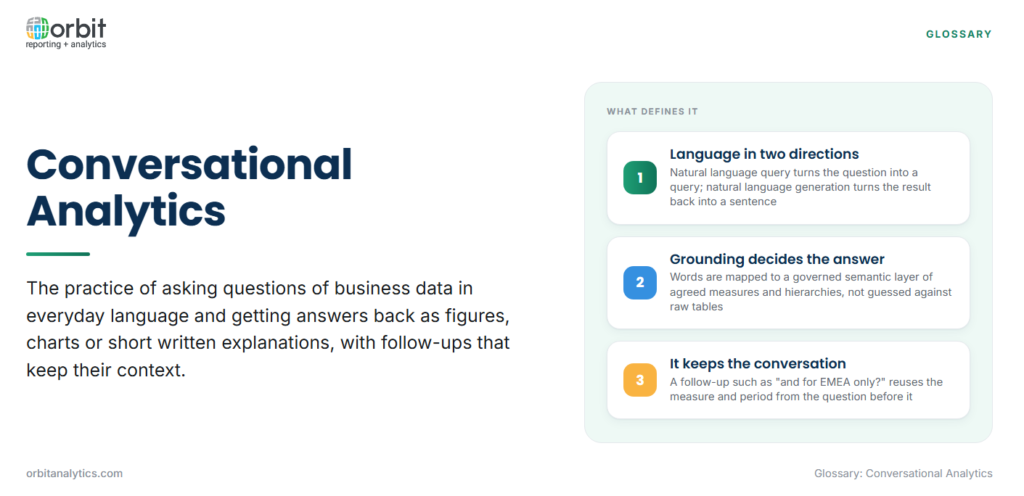
Conversational analytics is the practice of asking questions of business data in everyday language and getting answers back as figures, charts or short written explanations, with the option to ask a follow-up. Instead of opening a dashboard and setting filters, a user types “Which cost centres went over budget in Q2?” and the system works out which data to query, runs the query and returns the result.
The term covers language in two directions. Natural language query (NLQ) turns a question into a database query; natural language generation (NLG) turns the result back into a sentence someone can read. The conversational part is the loop between them, where context from one question carries into the next.
How Conversational Analytics Works
Every question passes through the same five stages.
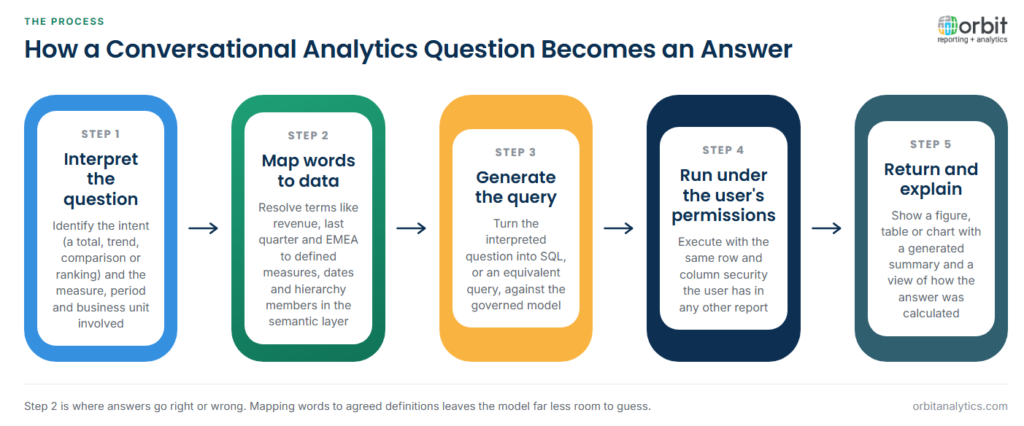
- Interpret the question. The system identifies the intent (a total, a trend, a comparison, a ranking) and the entities involved, such as a measure, a period and a business unit.
- Map words to data. “Revenue”, “last quarter” and “EMEA” are resolved to specific measures, date ranges and hierarchy members, ideally through a semantic layer rather than raw table names.
- Generate the query. The interpreted question becomes SQL, or an equivalent query, against the governed model.
- Run it under the user’s permissions. The query executes with the same row and column security the user would have in any other report.
- Return and explain. The result comes back as a number, table or chart, often with a generated sentence summarising it and a view of how it was calculated.
The follow-up is what makes it conversational. Asking “and for EMEA only?” reuses the measure and period from the previous question rather than starting again.
Natural Language Query and Natural Language Generation
NLQ and NLG are often bundled under one label, but they solve opposite problems.
- Natural language query (NLQ): converts a question into a precise query. Its hard problem is ambiguity: “sales” can mean bookings, invoiced revenue or cash received, and the system has to pick one or ask.
- Natural language generation (NLG): converts a result into prose, such as a sentence noting that operating expenses rose against budget, driven mainly by contractor spend. Its hard problem is accuracy: the sentence must say only what the numbers support.
- Dialogue management: tracks the conversation so that follow-ups like “what about last year?” resolve against the right question.
Large language models now power all three, making the interface more forgiving of loose phrasing without removing the need to define what the words mean.
Why the Semantic Layer Decides Answer Quality
A language model can write fluent SQL against almost any schema, but fluent is not the same as correct. Oracle ERP data shows why: “open payables by supplier” can touch several tables, currency conversion, ledger security and status codes whose meaning is not obvious.
A semantic layer sits between the question and those tables. It defines measures and how they are calculated, dimensions and hierarchies such as entity, cost centre and account, the joins known to be valid, and the security rules that apply. When the conversational engine maps words to this layer instead of raw tables, it has far less room to guess.
This is called grounding. An ungrounded answer comes from a plausible query the model invented; a grounded answer comes from definitions the finance and data teams already agreed. The same principle sits behind augmented analytics platforms, where AI assistance is only as good as the governed model underneath it.
What Users Can Ask
Most conversational questions fall into a handful of shapes.
| Question type | Example | What comes back |
|---|---|---|
| Lookup | What was total revenue in March? | A single figure |
| Trend | How has DSO moved over six quarters? | A line chart with a summary |
| Comparison | Compare actuals to budget by department | A variance table |
| Ranking | Top ten suppliers by spend this year | A sorted list or bar chart |
| Breakdown | What drove the rise in travel expense? | Contributing dimensions, ranked |
| Follow-up | Now show only the UK entity | The previous answer, re-filtered |
Lookups and rankings are the most reliable. “Why” questions are the hardest, because the system can show which dimensions moved but cannot know the business reason behind the movement.
Where Conversational Analytics Helps Finance and IT Teams
- Ad hoc finance questions: controllers and FP&A analysts get a quick figure without raising a report request or building a pivot table.
- Executive self-service: leaders who rarely open a BI tool can still ask for the number they need before a meeting, which supports data democratization without handing out raw access.
- Variance commentary: NLG drafts a first pass of month-end commentary, which an analyst then checks and edits.
- A smaller report backlog: BI and IT teams spend less time on one-off requests and more on the models those questions depend on.
Orbit Analytics applies this to Oracle data through augmented analytics that combines natural language query with natural language generation, so questions about Oracle Fusion Cloud and EBS data resolve against business definitions rather than raw tables.
Limits and Risks
Conversational analytics fails in specific and predictable ways.
- Hallucinated queries: a model may join tables incorrectly or invent a filter, producing a confident answer that is wrong. The risk is highest without a semantic layer.
- Ambiguous terms: words with several accepted meanings return different numbers depending on which meaning the system picks.
- Silent assumptions: a default period, currency or ledger the user never specified changes the figure without anyone noticing.
- Security leakage: if queries do not run under the requesting user’s permissions, a question can surface rows that user should never see.
- Overconfident narrative: generated text can describe a correlation as a cause.
None of these is a reason to avoid the approach. Each is a reason to show the working.
Making Conversational Answers Trustworthy
Teams that get dependable answers tend to follow the same practices.
- Ground every question in a governed model. Map language to defined measures and hierarchies, never directly to physical tables.
- Show how each answer was produced. Display the interpreted question, the filters applied and ideally the generated query, so a user can spot a wrong assumption.
- Ask when a term is ambiguous. A clarifying question is cheaper than a wrong figure in a board pack.
- Inherit source security. Run every query under the requesting user’s existing access rules.
The same pattern sits behind Websheet AI, which interprets plain-language requests inside a familiar spreadsheet-style grid, and Orbit Analytics applies it to governed Oracle data.
Conversational Analytics vs Dashboards and Traditional BI
Conversational analytics does not replace dashboards, because the two answer different kinds of question.
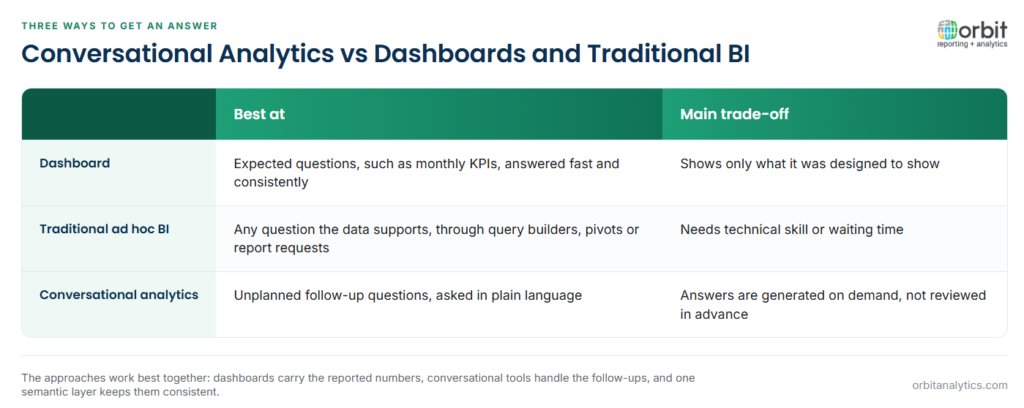
A dashboard is built in advance around expected questions, such as the monthly KPIs. It is fast, consistent and reviewed, but shows only what it was designed to show. Traditional ad hoc BI (query builders, pivot tables, report requests) answers anything the data supports, at the cost of technical skill or waiting time.
Conversational analytics sits between the two. It answers unplanned questions without the skill barrier, but each answer is generated on demand rather than reviewed in advance, so it carries more risk of misinterpretation. In practice, dashboards carry the reported numbers, conversational tools handle the follow-ups, and a shared semantic layer keeps both consistent.
Frequently Asked Questions
Q1. What is conversational analytics in simple terms?
It lets people ask questions about business data in plain language and get an answer back as a figure, chart or sentence. The system translates the question into a query, runs it and explains the result.
Q2. Is conversational analytics the same as a chatbot?
Not quite. A general chatbot answers from what its language model learned, while conversational analytics answers from an organisation’s own data by generating and running queries against it. The chat interface looks similar; the source of the answer is different.
Q3. Can conversational analytics give wrong answers?
Yes. The usual causes are ambiguous terms, assumptions the user did not state and, without a semantic layer, queries the model constructs incorrectly. Tools that display the interpreted question and filters make these errors easy to catch.
Q4. Does conversational analytics work with Oracle ERP data?
It can, but Oracle Fusion Cloud and EBS data models are complex enough that a semantic layer is close to essential. Mapping questions to curated business definitions, rather than hundreds of raw tables, is what makes the answers reliable.
Conversational analytics works when plain-language questions land on governed definitions rather than guesses. Orbit Analytics brings natural language query and generation to Oracle Fusion Cloud and EBS data with that grounding in place. Request a demo to see it answer questions about your own data.
