
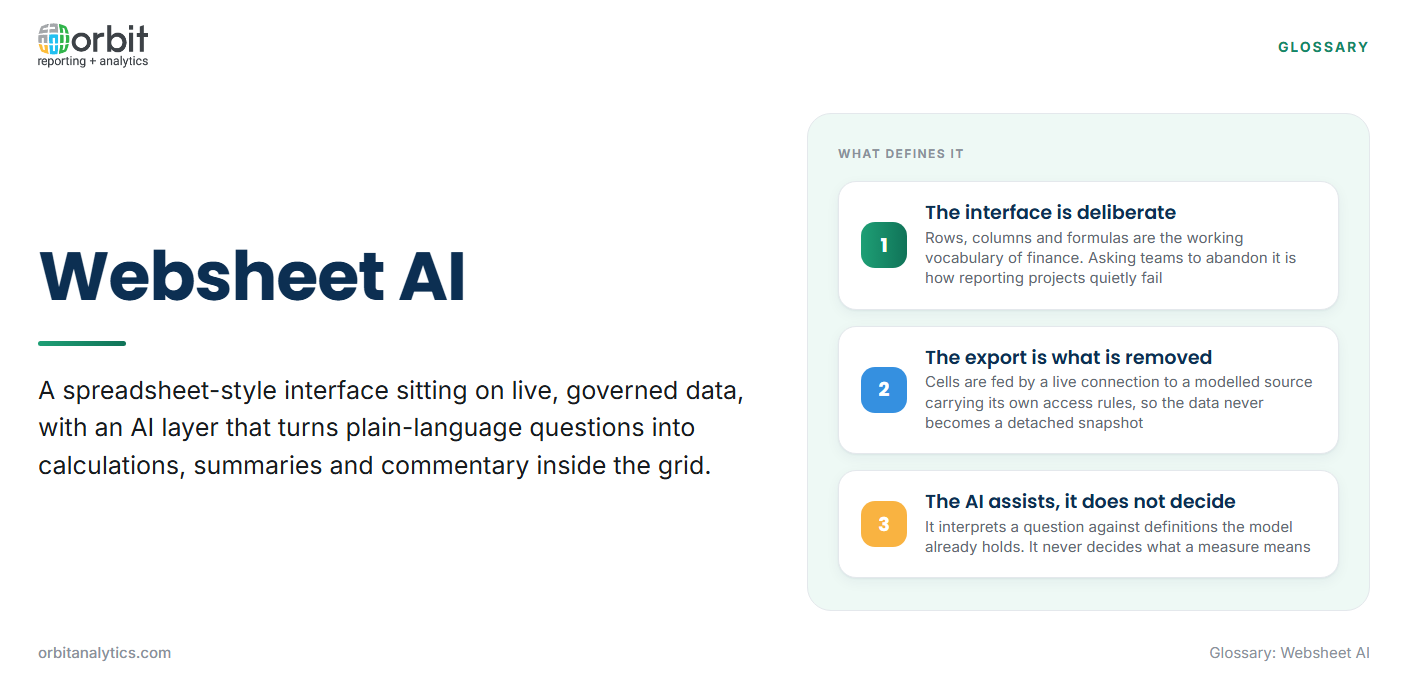
Websheet AI describes a spreadsheet-style interface sitting on live, governed data, with an AI layer on top that turns plain-language questions into calculations, summaries and commentary inside that grid. Neither term belongs to a single vendor, and the two halves are worth separating before anyone evaluates a product against them.
A websheet looks like a spreadsheet on purpose. Rows, columns, formulas and filters are the working vocabulary of finance teams, and asking them to abandon it is how reporting projects quietly fail. What changes is behind the grid: the cells are fed by a live connection to a modelled source carrying its own access rules.
The AI layer behaves like an assistant. It interprets a question against definitions the model already holds, drafts a calculation, or flags a movement worth a second look. It does not decide what a measure means, and that distinction runs through this page.
The Problem a Websheet Exists to Solve
Nearly every reporting stack in an Oracle environment ends in a spreadsheet. That is a rational response to what finance work requires, not indiscipline.
- The report stops short of the question: A standard report answers the question it was built for. The follow-up, a different grouping or a check against another system, happens in a grid anyway.
- Export breaks the link to the source: Once numbers land in a file they become a snapshot. Nothing tells the reader that the balance behind it has since moved.
- The reconciliation tax: Teams spend much of every close establishing whether two files agree, work created by the export rather than by the business.
- Access rules do not travel: Someone restricted to one entity in the ERP can be emailed a workbook covering every entity, and the file cannot know.
Banning spreadsheets never works, because the need underneath is real. A websheet keeps the interface and removes the export.
How a Websheet Differs From a Spreadsheet
The difference is structural, and four questions draw it out.
| Question | Spreadsheet | Websheet |
| Where does the data live? | In the file, frozen as of the export | In the source system, reached on demand |
| What does refresh mean? | Repeat the extract, rebuild the sheet | Re-query the connection, layout intact |
| Who can see which rows? | Whoever holds a copy of the file | Whoever the source system’s rules permit |
| What happens to formulas? | Local, private and unreviewed | Calculations applied to modelled measures |
A spreadsheet has a filename; a websheet has a governed source.
Where the AI Layer Fits
The AI layer does not replace the grid. It shortens the distance between a question and a usable answer in it.
- Natural language against a defined model: A question in business terms resolves against the measures and hierarchies the model contains, not raw table names.
- Assisted calculation building: A requested ratio or variance is drafted as a working calculation the user can inspect, keep or discard.
- Anomaly surfacing: The layer points at accounts or cost centres whose movement is unusual against their own history, instead of waiting to be asked.
- Narrative generation: A first draft of the explanation accompanying a variance pack, written from the numbers on screen and edited by whoever owns it.
Each assists with a step a person was already doing. None is a decision.
Why the Semantic Model Decides the Answer Quality
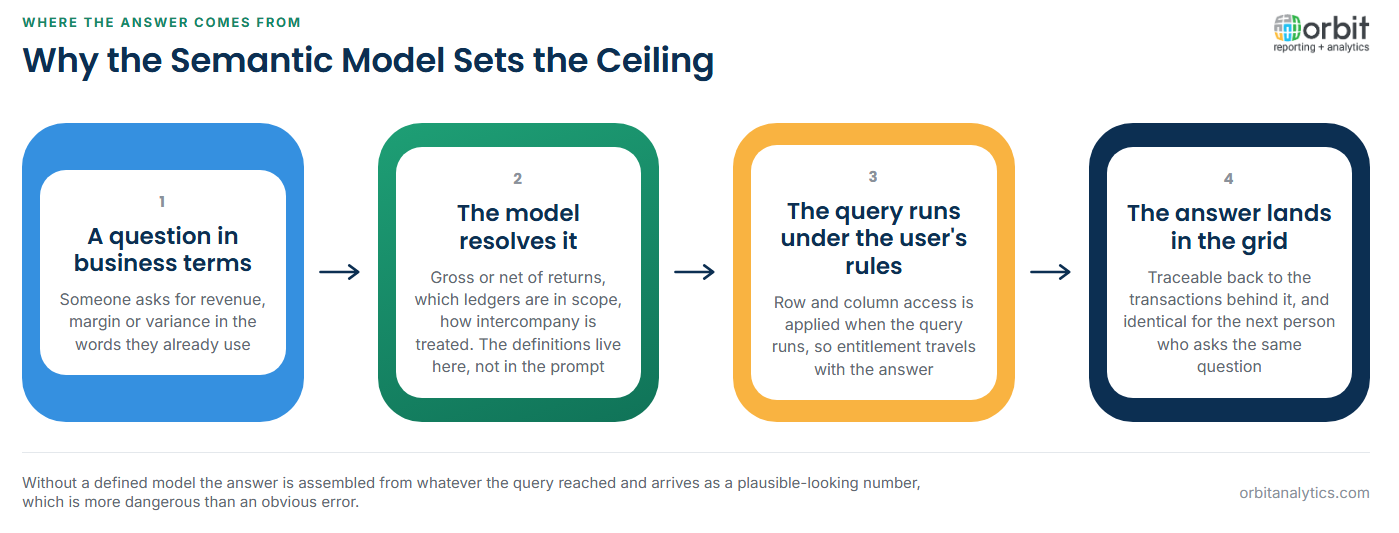
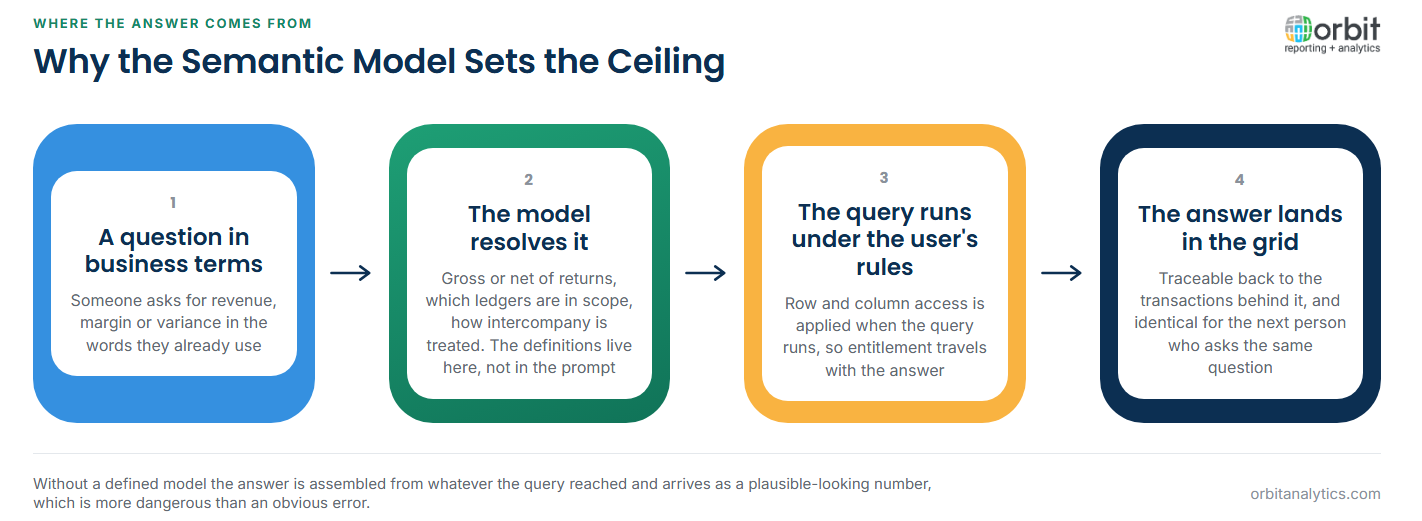
This is the part most vendor pages skip. An AI layer answers using the definitions it is given, so the quality ceiling is set by the model underneath, not by the phrasing of the question.
Ask for revenue, and something must decide whether that means gross or net of returns, which ledgers are in scope and how intercompany is treated. A defined model answers the same way every time. Without one, the answer is assembled from whatever the query reached and arrives as a plausible-looking number, which is more dangerous than an obvious error.
It is also why two teams report different figures for one measure: the disagreement is rarely in the data and almost always in the definition.
What Governance Means in This Context
Governance here does not mean a locked file. It means the rules that applied in the source system still apply while the data is worked on in a grid.
- Row and column level access: A user sees the entities, cost centres and accounts they are entitled to, applied when the query runs, not by hiding columns afterwards.
- One definition per measure: The calculation lives in the model, so two people asking the same question receive the same number.
- Traceability back to the transaction: Orbit Analytics supports drill-down from a summarised figure to the transaction detail behind it across Oracle Fusion Cloud and EBS, which is what makes a number defensible.
- Audit and retention: Who ran what, when, and against which version of the data, recorded as it happens.
Common Uses in Finance and Operations
Four patterns account for most real websheet use, and each is a case where a fixed report was not going to be enough.
- Period-end variance packs. Actuals against budget or prior period, with the commentary written next to the figure rather than in a separate document.
- Working schedules against live balances. Accruals, prepayments and reconciliation schedules built in the grid while the balances they reference stay connected to the ledger. Orbit Websheets is one implementation, with Orbit Analytics feeding those sheets from live Oracle data.
- Operational exception lists. Overdue receivables, blocked invoices or stalled orders, annotated by the people who clear them.
- Budget and forecast input collection. Inputs gathered from budget holders in the format they already use, without emailed workbooks.
What a Websheet AI Layer Cannot Do
An honest account of the limits is more useful than a feature list.
- It cannot invent data that is not modelled. If headcount was never brought into the model, no phrasing of the question produces a cost-per-employee figure.
- It cannot settle a definitional disagreement. Where two departments define margin differently, the layer answers per the model, and choosing that definition stays a human decision.
- It cannot replace review. A generated commentary is a draft, and whoever signs the pack is accountable for what it says.
- It is not always the right tool. A statutory return with a fixed layout is better served by standard self-service reporting output than by an interactive grid.
Websheets, Spreadsheets and BI Dashboards Compared
These three are usually presented as competitors. In practice they sit at different points in one workflow, doing different jobs.
A spreadsheet is built for individual, flexible calculation. It is unmatched for working something out, and once the numbers are in the file it has no idea where they came from. Handling ERP data in Excel carries both at once.
A BI dashboard is built for monitoring. It answers a known set of questions repeatedly for a wide audience, and is deliberately not a place to do your own arithmetic.
A websheet sits between them: the calculation freedom of the first, the governed source of the second. Most teams use all three.
Frequently Asked Questions
Q1. What is a websheet?
A websheet is a spreadsheet-style interface whose cells are fed by a live connection to a governed data source rather than by an exported file. The grid stays familiar; the data and its access rules stay with the source.
Q2. How is a websheet different from an Excel spreadsheet?
A spreadsheet holds a copy of the data as of the export, and anyone with the file sees all of it. A websheet queries the source when it opens and applies that system’s access rules.
Q3. What does the AI layer actually do?
It interprets business-language questions against the defined model, drafts calculations, points at unusual movements and writes first-draft commentary. It assists; it does not define.
Q4. Why does the semantic model matter so much?
Because the model, not the question, supplies the definitions. Whether revenue means gross or net and which ledgers are in scope are settled there, so a weak model returns answers that are not comparable.
Q5. Can a websheet replace a BI dashboard?
Usually not, and it is not meant to. A dashboard monitors a known set of measures for a wide audience, while a websheet is where someone works a question through.
A websheet is only as trustworthy as the definitions behind it, which is why the connection matters more than the interface. Orbit Analytics reports live across Oracle Fusion Cloud and EBS with 200+ pre-built connectors and drill-down to the transactions behind any figure. Request a demo to see it against your own data.
