
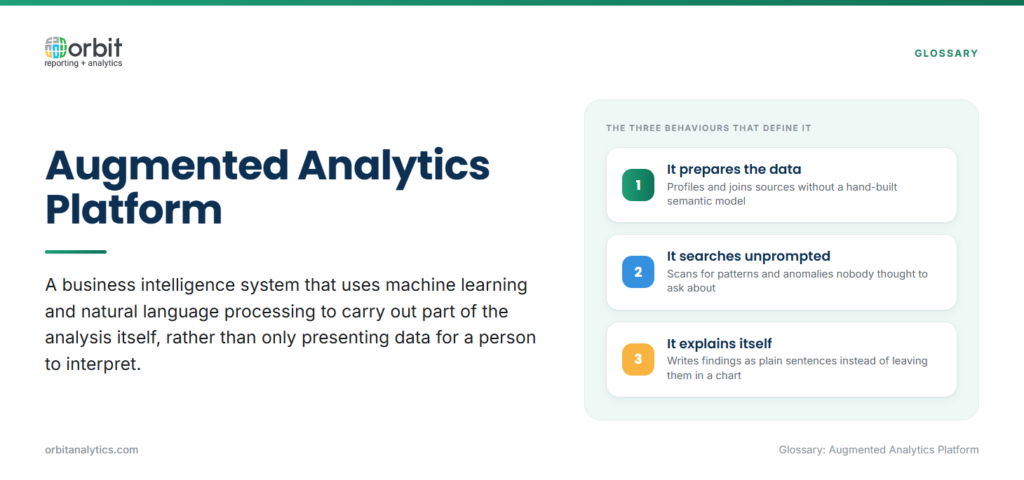
An augmented analytics platform is a business intelligence system that uses machine learning and natural language processing to carry out part of the analysis itself, rather than only presenting data for a person to interpret. It prepares the data, searches it for patterns, and explains what it found in plain language.
Gartner named the category in 2017 to describe a shift already underway: analytics tools were moving from passive display toward active discovery. What makes a platform augmented is not that AI appears somewhere in the product. It is whether the software performs analytical work a person would otherwise do by hand.
Three behaviours separate it from a conventional dashboard tool. It profiles and joins source data without a hand-built model, it scans for relationships nobody thought to ask about, and it reports findings as sentences instead of leaving them for the reader to spot in a chart.
Core Components of an Augmented Analytics Platform
Five capabilities appear in every serious implementation of the category:
- Automated data preparation: The platform profiles incoming tables, infers types, flags quality problems, and proposes joins, replacing scripting work that used to consume most of a project.
- Automated insight generation: Statistical routines run across the dataset unprompted, surfacing correlations, outliers, and segment differences before anyone asks.
- Natural language query and search: A user types a question in ordinary words and receives a chart or figure, without knowing table names or writing SQL.
- Predictive and prescriptive analytics: Models project forward and rank possible actions. See predictive analytics and prescriptive analytics for how those two differ.
- Auto-generated narratives: Findings are written as text, so a reader gets the interpretation alongside the visual.
How Does an Augmented Analytics Platform Work?
The sequence runs the same way regardless of vendor, and each stage feeds the next.
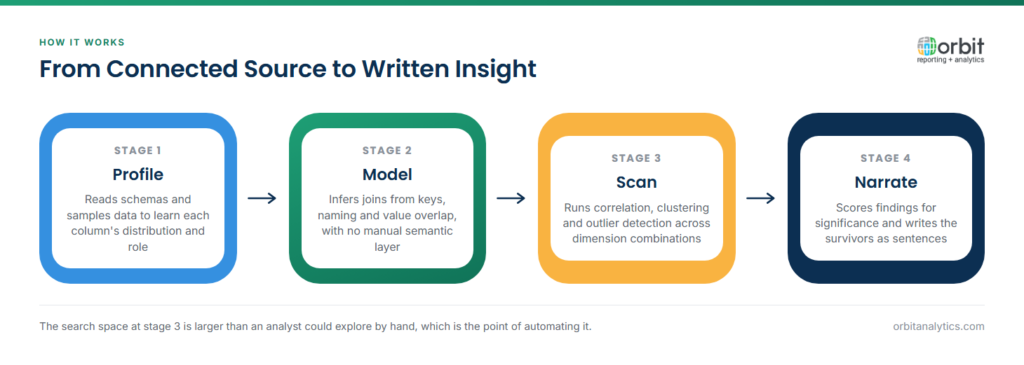
- Connect and profile the sources. The platform reads schemas, samples the data, and builds a statistical picture of every column: cardinality, distribution, null rate, and likely role.
- Model and join automatically. Relationships are inferred from keys, naming, and value overlap, producing a working model without a manual semantic layer.
- Scan for patterns and anomalies. Correlation, clustering, and outlier detection run across combinations of dimensions and measures, a search space too large to explore by hand.
- Turn findings into narratives. Each result is scored for significance, and the ones that clear the threshold are written into a sentence naming the metric, the movement, and the likely driver.
A business question therefore becomes an answer in one hop rather than three: no ticket, no extract, no analyst rebuilding a pivot that existed last quarter.
What an Augmented Analytics Platform Automates
Being precise about the boundary matters, because the gap between what these platforms do and what buyers assume they do is where disappointment comes from:
- Data preparation and joins: Work analysts used to script by hand.
- Insight discovery: Systematic scanning replaces manual slicing, so nothing depends on an analyst guessing the right cut.
- Forecasting and what-if analysis: Projections and scenarios are generated from history rather than built in a spreadsheet.
- Variance and anomaly alerting: The platform watches continuously and raises what moved.
- What stays human: Context, judgment, and governance. A platform can report that discounting rose 4% in one region. Only a person knows a competitor entered that market in March.
Why Oracle ERP Teams Need Augmented Analytics
For teams running Oracle Fusion Cloud or E-Business Suite, the obstacle is rarely the AI. It is getting clean, joined data to the point where the AI has something trustworthy to read.
OTBI and OBIEE were built for transactional and single-subject-area reporting. Both impose export ceilings and struggle to blend across pillars, so the cross-module questions that most benefit from automated discovery are the ones native tools answer least well. Underneath sits the schema problem: financial data spans hundreds of normalized tables, with multi-org and multi-ledger structures and flexfields carrying business meaning in generic column names.
Orbit Analytics addresses that layer first. Its augmented analytics capabilities read Fusion Cloud and EBS schemas natively through 200+ pre-built connectors and 1,000+ pre-built reports, so anomaly detection and natural language queries run against correctly joined ERP data from the start instead of after a modelling project.
Benefits of an Augmented Analytics Platform
- Faster time to insight. The interval between a question and a defensible answer shortens from days to minutes.
- Less dependence on IT and data scientists. Routine discovery moves to the people who own the numbers.
- Better decisions across functions. Finance, supply chain, and HR work from the same evidence rather than three exports.
- Wider adoption. Natural language lowers the skill floor, so more of the organization uses analytics at all.
Common Challenges and Misconceptions About Augmented Analytics
- It does not replace analysts. It removes the mechanical part of their work. Framing the question, judging whether a finding matters, and deciding what to do remain human.
- Data quality sets the ceiling. Automated discovery on inconsistent data produces confident, wrong answers faster than a human would.
- Explainability decides trust. A finding a user cannot trace back to the underlying records gets ignored, however sound the statistics.
- Governance has to scale with access. When anyone can ask any question, row-level security and audit trails stop being optional.
- Adoption stalls without business context. A statistically significant correlation that nobody can act on trains users to stop reading the alerts.
Augmented Analytics Examples by Business Function
| Function | What the platform surfaces |
| Finance | Close variance against plan, unusual journal activity, cash movements outside normal range |
| Supply chain | Demand shifts by product and region, supplier delivery performance drifting downward |
| HR | Attrition drivers by department and tenure, headcount and cost trends against plan |
| Sales and order management | Pipeline conversion changes, backlog ageing, discounting patterns by segment |
Orbit Analytics, an Oracle Gold Partner serving 150,000+ users, delivers automated insight generation, natural language query, and forecasting across all four of these functions, with governance controls and the option to push curated data to Snowflake, Databricks, Redshift, or Azure rather than locking it in one warehouse.
Augmented BI vs Traditional BI vs Self-Service BI
The three approaches are often used interchangeably. They differ in who performs the analysis.
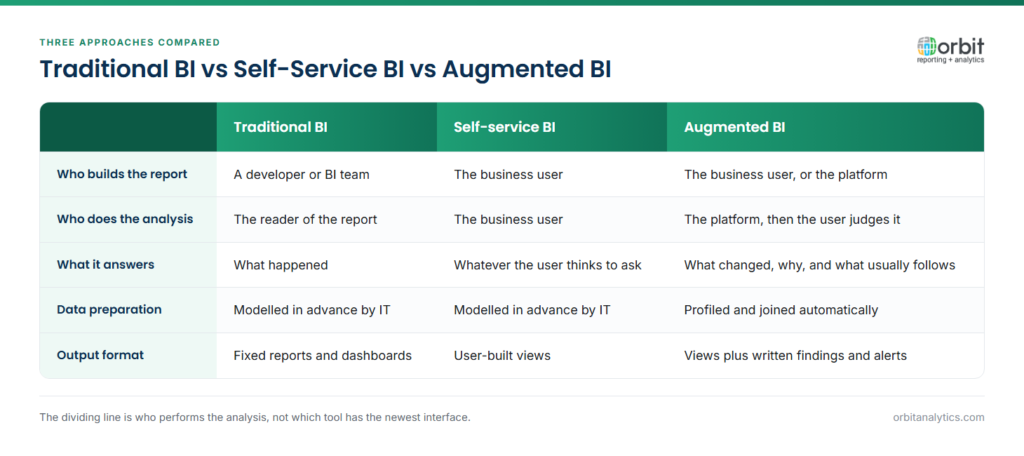
Traditional business intelligence reports what happened, and a developer builds each report. Self-service BI hands the building work to the business user but leaves the analysis with them. Augmented BI performs part of the analysis itself, which is the whole of the difference. Augmented BI adds most value where the data is wide, the questions are open-ended, and nobody has time to explore every combination manually.
Frequently Asked Questions
Q1. What is an augmented analytics platform in simple terms?
It is a BI platform that does some of the analysis for you. Instead of only drawing charts from data you select, it prepares the data, looks for patterns on its own, and describes what it found in plain sentences.
Q2. How is augmented analytics different from traditional business intelligence?
Traditional BI presents data and leaves interpretation to the reader, with each report built by a developer. Augmented analytics automates preparation and discovery, and generates written findings, so it produces observations rather than only views.
Q3. Is augmented analytics the same as self-service BI?
No. Self-service BI lets business users build their own reports, but the analysis is still theirs to do. Augmented analytics performs part of that analysis automatically. Most platforms offer both, which is why the terms get blurred.
Q4. What AI and machine learning techniques power augmented analytics?
Typically statistical correlation and significance testing, clustering and segmentation, outlier detection, time-series forecasting, and natural language processing for both query interpretation and narrative generation.
Q5. Can augmented analytics replace data scientists?
No. It automates routine preparation and pattern discovery, which frees data scientists for causal work, experiment design, and custom modelling. It does not supply the business context that decides whether a finding matters.
Q6. Does augmented analytics work on Oracle Fusion Cloud and EBS data?
Yes, provided the platform understands the Oracle data model. The difficulty is not the analytics but the extraction and joining of multi-org, multi-ledger ERP data, so platforms with native Oracle schema support reach a usable result considerably faster.
Augmented analytics is only as good as the data underneath it, which is why Oracle-native connectivity matters more than the algorithms. Request a demo to see how Orbit Analytics delivers automated insight, natural language query, and forecasting on live Oracle Fusion Cloud and EBS data.
