
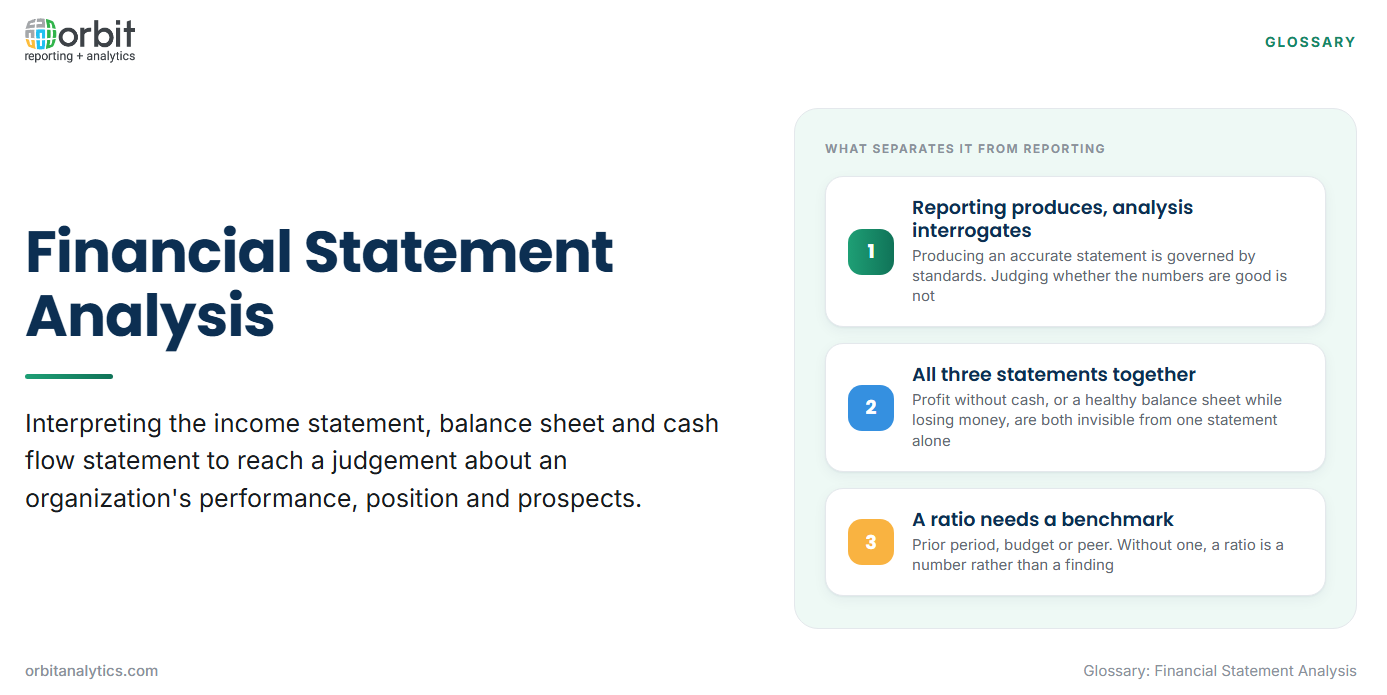
Financial statement analysis is the practice of interpreting an organization’s financial statements to reach a judgement about its performance, position and prospects. Where reporting produces the statements, analysis interrogates them: it asks whether the numbers are improving, how they compare with a relevant benchmark, and what is driving the movement.
The distinction is worth holding onto. Producing an accurate income statement is a financial reporting task governed by accounting standards. Deciding whether a fourteen per cent gross margin is good is an analytical one, and it depends entirely on context that the statement itself does not contain.
The three statements under analysis
- The income statement shows revenue, costs and profit over a period. It answers whether the organization is trading profitably, and at what margin.
- The balance sheet shows assets, liabilities and equity at a single date. It answers what the organization owns and owes, and how it is financed.
- The cash flow statement shows movements of cash across operating, investing and financing activities. It answers whether reported profit is converting into money.
All three are read together because each can mislead alone. A business can report strong profit while running out of cash, because revenue recognized is not the same as cash collected. It can show a healthy balance sheet while losing money every month. Analysis that looks at one statement in isolation reliably produces the wrong conclusion.
The main methods of financial statement analysis
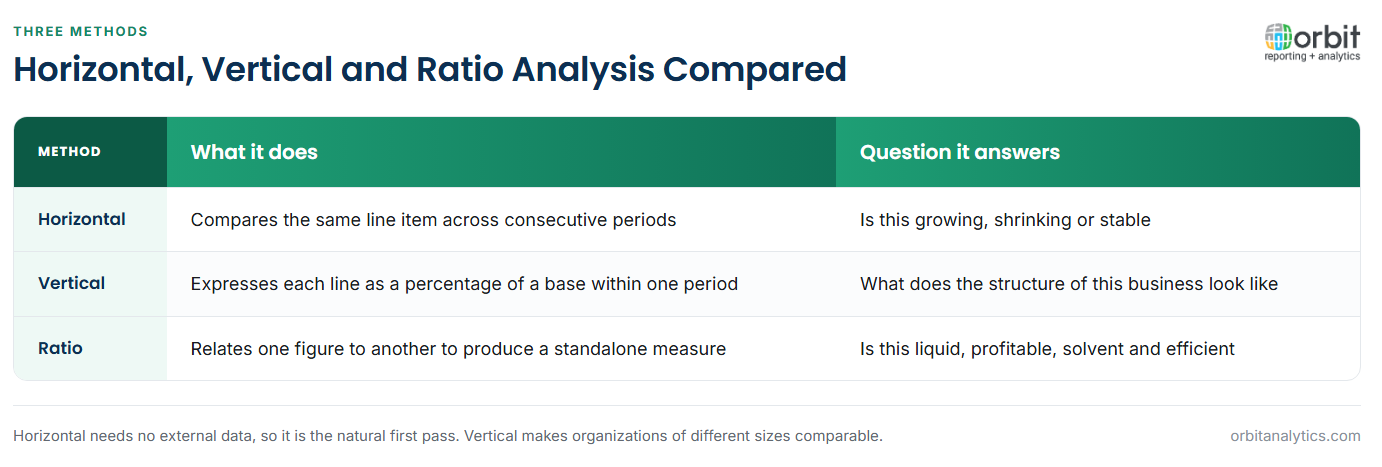
Three techniques cover most of what analysts actually do, and they answer different questions.
Horizontal analysis compares the same line item across consecutive periods, expressing the change in absolute and percentage terms. It answers whether something is growing, shrinking or stable, and it is the natural first pass because it needs no external data.
Vertical analysis expresses every line as a percentage of a base figure within the same period, usually revenue for the income statement and total assets for the balance sheet. It answers what the structure of the business looks like, and it makes organizations of very different sizes comparable.
Ratio analysis relates one figure to another to produce a measure that carries meaning on its own, such as current assets divided by current liabilities. It answers questions about liquidity, profitability and efficiency that no single line item can.
Trend and common-size analysis extend the first two over longer horizons, restating several years on a common base so that structural drift becomes visible.
The ratio families and what they reveal
| Family | Question it answers | Representative ratios |
| Liquidity | Can short-term obligations be met? | Current ratio, quick ratio |
| Profitability | Is the business earning a return? | Gross margin, net margin, return on equity |
| Solvency | Is the capital structure sustainable? | Debt to equity, interest cover |
| Efficiency and activity | Are assets being used productively? | Inventory turnover, receivable days |
| Valuation | What is the market paying for earnings? | Price to earnings, earnings per share |
The families are not independent. A rise in inventory turnover usually improves the cash conversion cycle, which shows up in liquidity. Reading one family alone is the ratio equivalent of reading one statement alone.
How to perform financial statement analysis
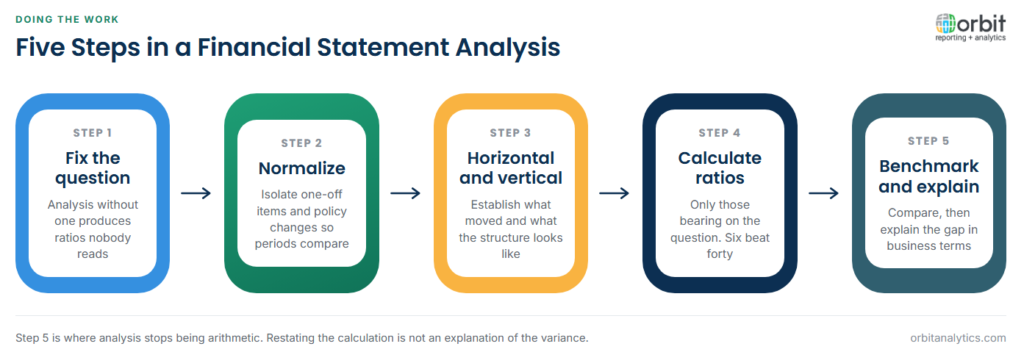
- Establish the question and the period. Analysis without a question produces a page of ratios nobody reads. Decide first what decision the work supports.
- Normalize the statements. Remove or isolate one-off items, restatements and accounting policy changes so that periods are genuinely comparable.
- Apply horizontal and vertical views. Establish what moved and what the structure looks like before calculating anything more sophisticated.
- Calculate the relevant ratios. Only the ones that bear on the question. Six well-chosen ratios beat forty presented without comment.
- Benchmark and explain the variance. Compare against a baseline, then explain the gap in business terms rather than restating the arithmetic.
Benchmarking and context
A ratio without a benchmark is a number, not a finding. Three baselines are commonly used and each answers something different.
- Prior period comparison shows direction of travel. It is the easiest to obtain and the easiest to over-read, because a favourable movement from a poor base is still a poor position.
- Budget and forecast comparison shows performance against intent, which is what management is usually accountable for.
- Industry and peer comparison shows whether performance is genuinely good or simply typical for the sector. It is the hardest to source and the most valuable.
Maintaining these comparisons is where analysis becomes an operational problem rather than a technical one, because the baselines have to be refreshed every period. Orbit Analytics builds the comparison set once over live ledger data instead of rebuilding it each month, so the analysis stops competing with the close for attention. Reporting aimed at senior readers, such as executive reporting, depends on exactly this: the benchmark arriving with the number.
Financial statement analysis in Oracle ERP environments
Analysis is only as good as the balances it starts from, and in an Oracle environment those balances come from the general ledger. Three practical difficulties recur. Multi-entity groups need analysis at entity, region and group level, and each level requires a different consolidation of the same data. Multi-currency operations need a decision about which rate the comparison uses, since a margin can appear to move purely on translation. And any analysis that requires a figure not held in the general ledger, such as headcount or units shipped, needs a second source joined reliably to the first.
Orbit Analytics provides general ledger reporting that reads live Oracle E-Business Suite and Fusion Cloud balances, so the ratios recalculate against current data rather than a month-old extract, and every figure retains a path back to the journals behind it.
Limitations of financial statement analysis
- Historical data only. The statements describe what has happened. They support inference about the future but do not contain it.
- Accounting policy differences. Two organizations can report the same economic reality differently through depreciation methods, revenue recognition timing or inventory valuation, which makes raw peer comparison unreliable.
- Seasonality and one-off items. A single quarter compared against the prior quarter can be dominated by seasonal pattern rather than performance, and a disposal or impairment can distort every profitability ratio in the set.
- What the numbers cannot show. Customer concentration, key person dependency, pending litigation and the state of the order book all shape prospects and appear nowhere in a ratio.
Recognizing these limits is what separates analysis from arithmetic. The most useful output usually pairs the calculation with a short written explanation of what it does and does not support.
Frequently Asked Questions
Q1. What is financial statement analysis?
It is the interpretation of an organization’s income statement, balance sheet and cash flow statement to form a judgement about performance, position and prospects, usually by comparing figures across periods, structures or benchmarks.
Q2. What are the three methods of financial statement analysis?
Horizontal analysis compares line items across periods. Vertical analysis expresses each line as a percentage of a base within one period. Ratio analysis relates figures to each other to produce measures of liquidity, profitability, solvency and efficiency.
Q3. What is the difference between horizontal and vertical analysis?
Horizontal analysis looks across time at how a line item has changed. Vertical analysis looks within a single period at how large each line is relative to a base such as total revenue.
Q4. What is the difference between financial reporting and financial statement analysis?
Reporting produces the statements according to accounting standards. Analysis starts once those statements exist and asks what they mean, which requires benchmarks and context the statements do not contain.
Q5. What are the limitations of financial statement analysis?
It relies on historical data, is affected by differing accounting policies between organizations, can be distorted by seasonality and one-off items, and cannot capture qualitative risks such as customer concentration or pending litigation.
Q6. Can financial statement analysis be automated?
The calculation and the benchmark comparison can be automated entirely and should be. The interpretation, which is deciding what the variance means and what to do about it, remains a judgement.
Analysis loses most of its value when the underlying figures are a month old. Orbit Analytics recalculates ratios and variances against live Oracle ledger balances, with drill-down from any result to the transactions behind it. Request a demo to see it on your own statements.
