
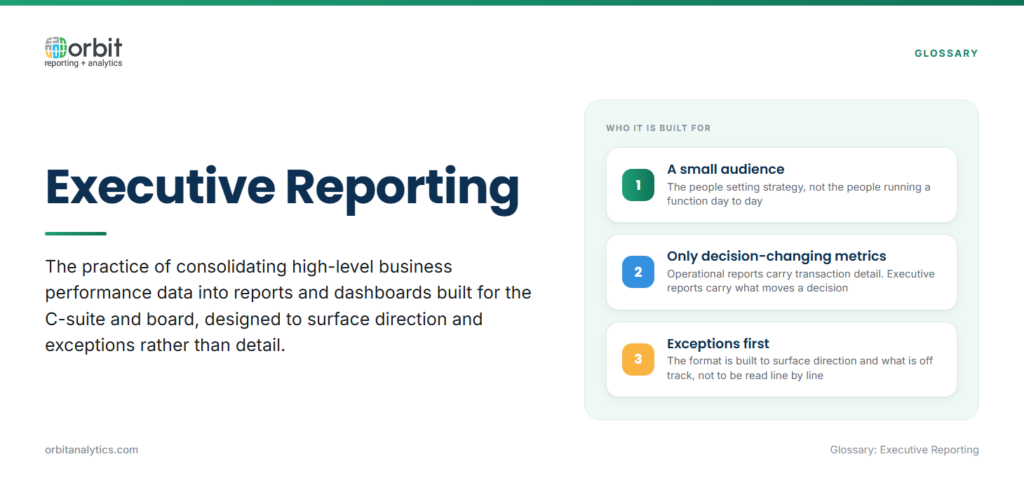
Executive reporting is the practice of consolidating high-level business performance data into reports and dashboards built for the C-suite and board. The audience is small, the cadence is fast, and the format is designed to surface direction and exceptions rather than detail.
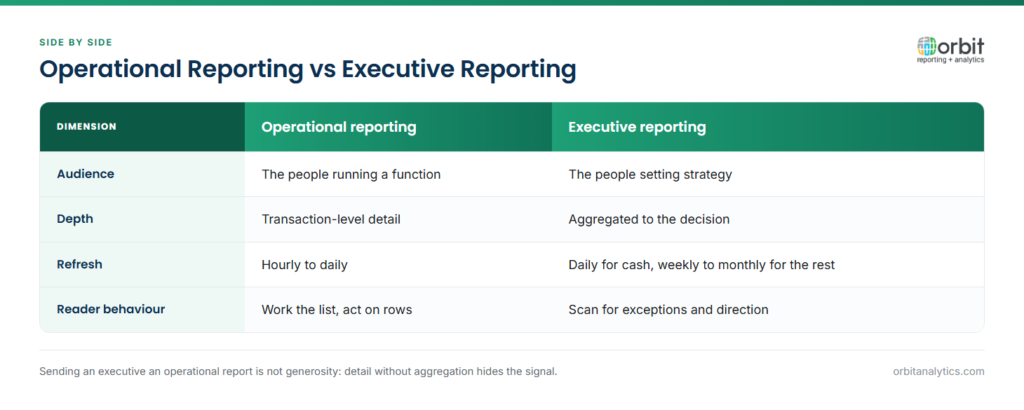
It differs from operational reporting in audience, depth, and refresh. Operational reports go to the people running a function, the AR team, the plant manager, the regional sales lead, and carry transaction-level detail. Executive reports go to the leaders setting strategy and carry only the metrics that change a decision.
In a healthy organization, executive reporting is the shared language of the leadership team. Everyone reviews the same numbers on the same cadence, and discussions move from “whose number is right” to “what do we do about it”.
Why is Executive Reporting Important?
Four shifts happen when executive reporting works:
- Faster decisions. Leaders no longer wait for analysts to assemble the latest numbers before a meeting can proceed.
- A unified view of business performance. Revenue, margin, cash, and operational KPIs sit in one place rather than across three slide decks.
- Tighter board and investor communication. A consistent metric set on a known cadence removes the “which version is right” friction before every meeting.
- Earlier warning signals. Issues surface in the week they happen, not the month after.
Key Components of Executive Reports
A useful executive report has four components:
- KPIs and metrics that genuinely matter. Eight to twelve numbers that move strategy, not every measure the analyst team can produce.
- Trend analysis and period comparisons. The leader sees direction, not just a snapshot.
- Exception-based highlighting. Attention goes to what changed, not to the lines that did not move.
- Clear, actionable insights. A sentence or two that names what the data means and the implied action.
Skip any of these and the report drifts back toward being a data dump.
Essential Executive Reporting Metrics
The metric set varies by company but tends to cluster into four groups:
- Financial KPIs: revenue, gross margin, EBITDA, operating cash flow, free cash flow, budget vs. actual variance.
- Operational KPIs: units produced or sold, on-time delivery, quality or defect rate, capacity utilization, throughput.
- Customer KPIs: retention or churn, customer satisfaction (NPS or CSAT), customer lifetime value, customer acquisition cost.
- Strategic KPIs: market share, growth rate, new product or market revenue, employee engagement.
Pick 8 to 12 from across these groups. The exact mix depends on the company’s strategy: a growth-stage business will emphasize CAC and pipeline; a mature manufacturer will emphasize margin and capacity.
Executive Dashboard Design Principles
Simplicity beats completeness. An executive dashboard is a tool for direction, not for exploration: anything that does not change a decision belongs in a secondary view.
Use visual hierarchy. The most important number sits top-left, the next most important top-right, and supporting context fills the rest of the grid. Drill-down is mandatory on every tile so the executive can move from a margin number to the underlying detail in two clicks.
Mobile matters. Executives review numbers between meetings, in airports, and on phones. Dashboards that only work on a 27-inch monitor get used twice and abandoned. Orbit Analytics builds dashboards that render natively on mobile while keeping the drill-down behavior of the desktop view, so the same dashboard works whether the CEO is at her desk or in transit.
Types of Executive Reports
Different roles need different views, but they share a data model:
- CEO dashboard: overall business health, revenue, EBITDA, cash, customer metrics, strategic initiative progress.
- CFO dashboard: financial performance, P&L, cash, working capital, variance to budget. See our CFO dashboard guide for the full metric breakdown.
- COO dashboard: operational efficiency, production, quality, on-time delivery, capacity, supply chain.
- Board reports: governance, compliance, risk, strategic initiative status, market position.
The discipline is that all of these read from the same underlying data so the numbers reconcile across views.
Challenges in Executive Reporting
Four challenges show up in nearly every program:
- Data aggregation across systems. Executive reports need data from ERP, CRM, HR, and operational systems, which rarely agree on customer, product, or organizational hierarchies out of the box.
- Accuracy and timeliness. A report that is two weeks behind reality is one leaders learn to distrust.
- Balancing detail with clarity. The same report needs to answer “where are we” at a glance and “why did this move” on a click.
- Keeping reports relevant. Most executive reporting programs degrade over time because the metric set never gets pruned. The fix runs from governed data management upstream to a clean business intelligence layer on top.
Best Practices for Executive Reporting
Four practices keep a program disciplined as it scales:
- Define metrics with executive input. Reports designed by analysts in isolation tend to answer the wrong questions.
- Automate data collection and refresh. If the report depends on someone exporting a CSV every Monday, it will be late or wrong within a quarter.
- Use consistent visualization standards. The CFO dashboard, the CEO dashboard, and the board pack should all use the same color, scale, and trend conventions.
- Include context with every number. A revenue number without a comparison (vs. plan, vs. prior period, vs. forecast) is just a digit on a screen.
How to Build an Executive Reporting Program
A reliable rollout follows four sequential steps:
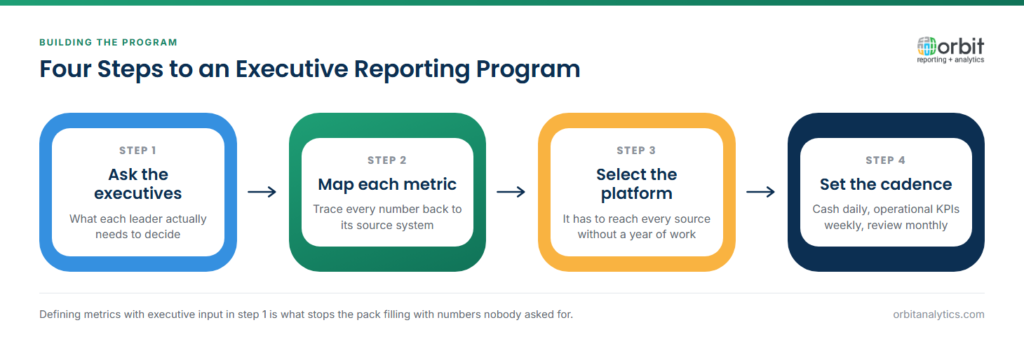
- Identify the executive information needs. Sit with each member of the leadership team and ask which 10 numbers they would most want on a phone. The overlap of those lists is the executive metric set.
- Map each metric to its source. Most financial KPIs come from Oracle GL; operational KPIs from Order Management, Inventory, and Manufacturing; customer KPIs from CRM or service systems.
- Select the platform. Orbit Analytics provides self-service executive dashboards that read directly from Oracle Fusion Cloud, EBS, and NetSuite, with pre-built CFO and COO templates plus Quicklets for one-click executive insights that can be embedded anywhere.
- Establish the cadence. Use the table below as a starting point, then build it into the close calendar so it does not depend on goodwill.
| Metric category | Refresh cadence |
| Cash and revenue | Daily |
| Operational KPIs | Weekly |
| Formal leadership review | Monthly |
| Board pack | Quarterly |
Frequently Asked Questions
Q1. What is executive reporting?
Executive reporting is the practice of consolidating high-level business performance data into reports and dashboards built for the C-suite and board. The format surfaces direction and exceptions rather than detail, with 8 to 12 KPIs that change strategic decisions.
Q2. What is the difference between executive and operational reporting?
Operational reports go to the people running a function and carry transaction-level detail at high refresh frequency. Executive reports go to leaders setting strategy and carry only the metrics that change a decision, in a summarized format. They share the same underlying data but answer different questions.
Q3. What metrics should be included in executive reports?
Most effective programs track 8 to 12 KPIs across financial (revenue, margin, cash, variance), operational (throughput, quality, on-time delivery), customer (retention, satisfaction, lifetime value), and strategic (market share, growth) categories. The exact mix depends on company strategy.
Q4. What makes a good executive dashboard?
Simplicity, visual hierarchy, drill-down on every tile, mobile readiness, and context with every number. A dashboard that needs explanation is not finished.
Q5. How do you automate executive reports?
Connect the reporting layer directly to source systems (ERP, CRM, HR, operational) with pre-built connectors, schedule refreshes daily or hourly, and use exception-based alerts to surface significant changes. Removing manual exports is what turns a report into a tool.
Q6. What tools are used for executive reporting?
Most leading platforms combine pre-built ERP connectors, a self-service dashboard layer, and mobile delivery. For Oracle ERP customers, the differentiator is how directly the platform reads Fusion, EBS, or NetSuite without a separate semantic-modeling project.
Ready to give your leadership team a live, mobile-ready view of the metrics that matter? Request a demo to see how Orbit Analytics delivers executive reporting on top of your Oracle ERP.
