
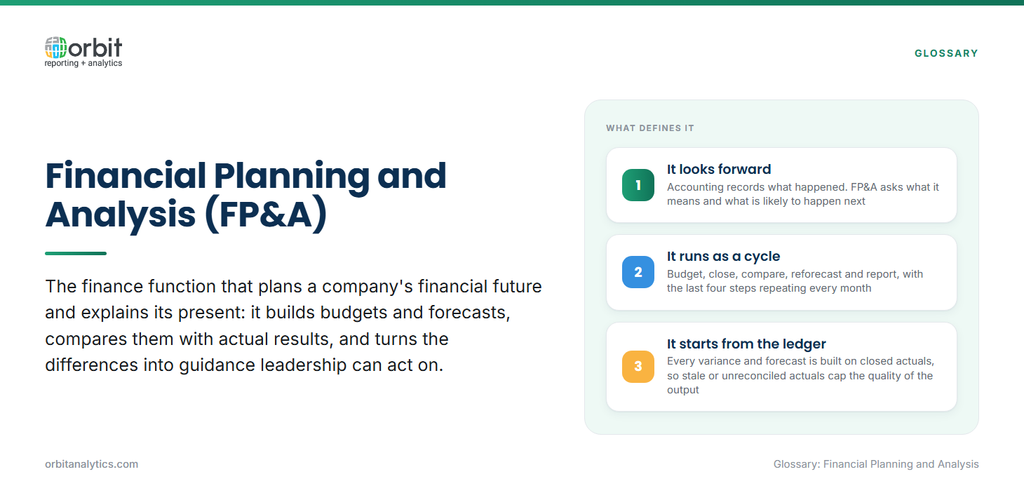
Financial planning and analysis (FP&A) is the finance function that plans a company’s financial future and explains its financial present: it builds budgets and forecasts, compares them with actual results, and turns the differences into guidance leadership can act on. Where accounting records what has happened, FP&A asks what it means and what is likely to happen next.
In most organisations FP&A reports to the CFO and sits between the accounting team, which closes the books, and the business leaders who run departments, product lines or regions. It takes the numbers the close produces and translates them into the language of decisions: headcount, pricing, investment and targets.
What FP&A Teams Actually Do
The work varies by company size, but six activities make up the core of almost every FP&A team:
- Budgeting: building the annual financial plan with department heads, setting revenue targets and spending limits for the year ahead. Methods vary, from incremental budgets to zero-based budgeting.
- Forecasting: re-estimating the full-year outcome as the year unfolds, often monthly or quarterly, so leadership knows where results are heading rather than where they were planned to go.
- Variance analysis: comparing actual results with budget and forecast, then explaining each material difference by its cause.
- Management reporting: producing the monthly pack of P&L, KPIs and commentary that executives and the board review.
- Scenario modelling: testing how results change under different assumptions, such as a price increase, a hiring freeze or a currency move.
- Decision support: building the business case for a specific choice, such as opening a site, launching a product or approving a capital project.
The FP&A Planning Cycle
FP&A runs as a repeating loop rather than a once-a-year event:
- Set targets from strategy. Leadership agrees the growth, margin and investment goals the plan has to deliver.
- Build the annual budget. FP&A works with each department to turn those goals into revenue, cost and headcount lines.
- Close the month and load actuals. Accounting closes the period, and the actual results from the general ledger become available.
- Compare, explain and reforecast. Actuals are measured against plan, variances are explained, and the full-year forecast is updated.
- Report to leadership. Results, explanations and the revised outlook go to executives, who adjust decisions accordingly.
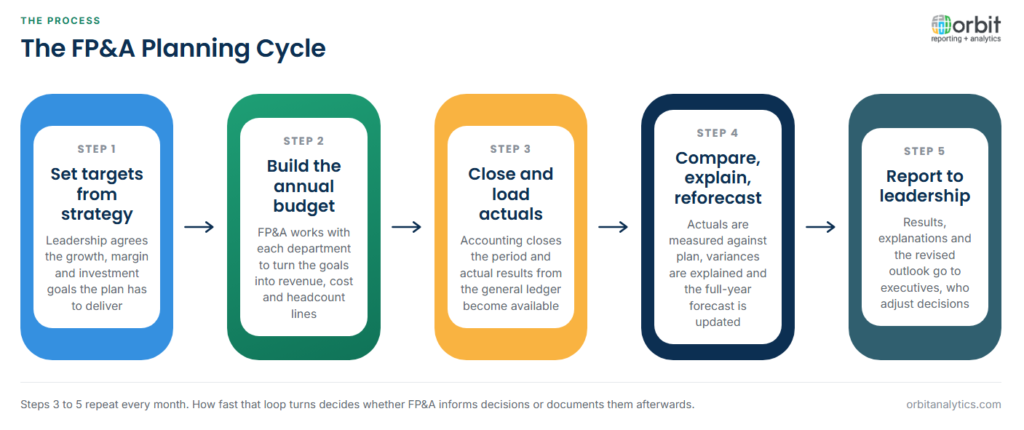
Steps 3 to 5 repeat every month. The speed of that monthly loop is what separates an FP&A team that informs decisions from one that documents them after the fact.
Budgets, Forecasts and Scenarios
These three outputs are often confused, but each answers a different question:
| Output | Question it answers | How often it changes | Typical use |
|---|---|---|---|
| Budget | What did we commit to achieve? | Set once a year, rarely revised | Accountability and spending limits |
| Rolling forecast | Where are we actually heading? | Updated monthly or quarterly | Resource and cash planning |
| Scenario | What happens if an assumption changes? | Built on demand | Testing risks and options |
Many teams build forecasts from operational drivers rather than prior-year figures. Driver-based forecasting links revenue and cost lines to volumes, prices and headcount, so a change in one driver flows through the whole model.
The Data FP&A Depends On
A forecast is only as reliable as the actuals it starts from, and FP&A draws on more sources than any other finance team:
- General ledger actuals: the closed results by account, cost centre and entity, which are the baseline for every comparison.
- Subledger and operational detail: receivables, payables, orders, inventory and projects, which explain why a ledger total moved.
- Headcount and payroll data: usually the largest controllable cost, held in HR systems rather than the ledger.
- Non-financial drivers: units shipped, customer counts, utilisation rates and other operational measures that forecasts are built on.
The practical difficulty is that these sources rarely share a calendar, a chart of accounts or a definition of the same entity. Much of an FP&A analyst’s month goes into mapping one to another before any analysis starts, which is why data access is as much an FP&A concern as it is an IT one.
FP&A in an Oracle ERP Environment
For companies on Oracle Fusion Cloud or Oracle EBS, the actuals live in the Oracle general ledger while the plan often lives in a separate planning tool or a set of spreadsheets. Every variance report therefore starts by bringing the two together, and every mismatch in account mapping or period cut-off becomes an FP&A problem.
Orbit Analytics provides Oracle Fusion financial reporting that reads GL actuals directly from Oracle Fusion Cloud and EBS, so plan and actual figures can sit in one view with drill-down from any line to the journals behind it. Analysts who prefer to model in spreadsheets can use Excel reporting that refreshes live ledger data into their workbooks instead of relying on pasted exports.
Common FP&A Challenges
- Time spent assembling data: analysts often spend more of the month collecting and reconciling numbers than interpreting them. Orbit Analytics addresses this with 200+ pre-built connectors that bring ERP, HR and operational data into one reporting layer.
- Plans built on stale actuals: a forecast refreshed from last month’s export is already out of date when it reaches leadership.
- Multiple versions of the truth: when each department keeps its own spreadsheet, meetings turn into arguments about whose figure is right.
- Forecasts nobody revisits: a forecast that is never compared with the outcome cannot improve, so forecast accuracy itself should be tracked.
- Commentary that restates the numbers: a variance explained as “revenue was below budget” tells leadership nothing. Useful commentary names the cause and what, if anything, should change.
FP&A vs Financial Accounting
The two disciplines work from the same ledger but face in opposite directions. Financial accounting records what happened: it closes the books, applies accounting standards and produces statements that auditors can verify. Its output has to be precise, complete and backward-looking.
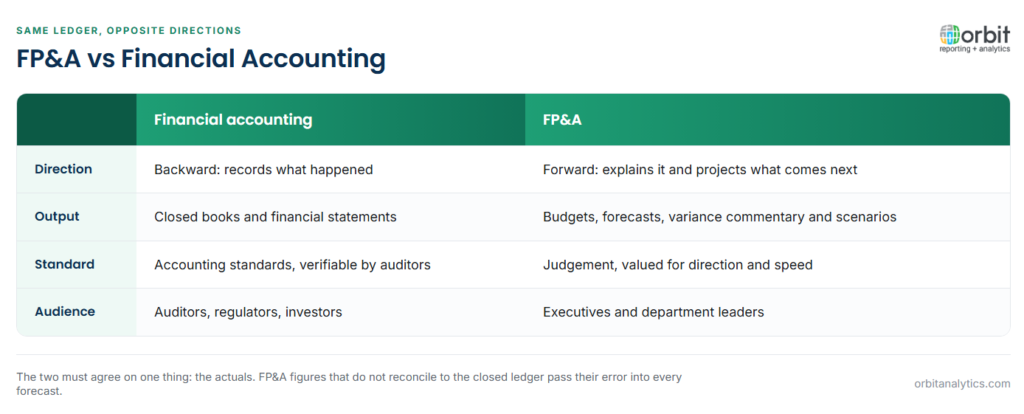
FP&A explains and projects what happened. Its output is judgement: why margin fell, what the year will land at, which option is better. Precision matters less than direction and speed, and its audience is management rather than external stakeholders.
Where the two must agree is the actuals. If FP&A’s starting figures do not reconcile to the closed ledger, every variance and forecast built on them inherits the error.
Frequently Asked Questions
Q1. What is financial planning and analysis?
Financial planning and analysis is the finance function responsible for budgeting, forecasting, variance analysis and management reporting. It turns recorded results into plans and explanations that guide business decisions.
Q2. What is the difference between FP&A and accounting?
Accounting records and reports what has happened, to accounting standards, for external and statutory use. FP&A uses those results to explain performance and project the future for internal decision-makers.
Q3. What is the difference between a budget and a forecast?
A budget is the plan the business commits to at the start of the year and is rarely changed. A forecast is a regularly updated estimate of where results will actually land, given what has happened so far.
Q4. How often does FP&A reforecast?
Most teams reforecast monthly or quarterly, often as a rolling forecast that always looks a fixed number of months ahead. The cadence usually follows the month-end close, since each close delivers new actuals.
Q5. What data does FP&A use?
FP&A starts from general ledger actuals and adds subledger detail, headcount and payroll data, and operational drivers such as volumes and prices. The ledger is the baseline, and the other sources explain its movements.
Q6. What is scenario modelling in FP&A?
Scenario modelling tests how financial results change under different assumptions, such as lower volumes, higher input prices or a delayed hire. It helps leadership see the range of likely outcomes and prepare responses before a risk materialises.
FP&A is only as fast as the actuals it receives and as credible as their link to the ledger. Orbit Analytics puts live Oracle GL data alongside plan figures so analysts spend the month explaining results instead of assembling them. Request a demo to see it with your own ledger.
