
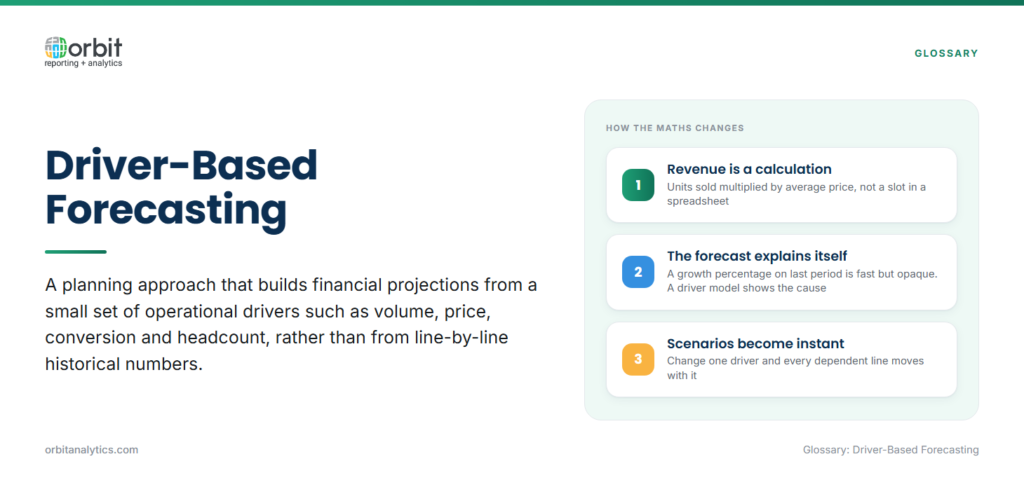
Driver-based forecasting is a planning approach that builds financial projections from a small set of operational drivers, volume, price, conversion, utilization, headcount, rather than from line-by-line historical numbers. Revenue is not a slot in a spreadsheet; it is units sold multiplied by average price. Personnel cost is not a fixed assumption; it is headcount multiplied by fully loaded cost per employee.
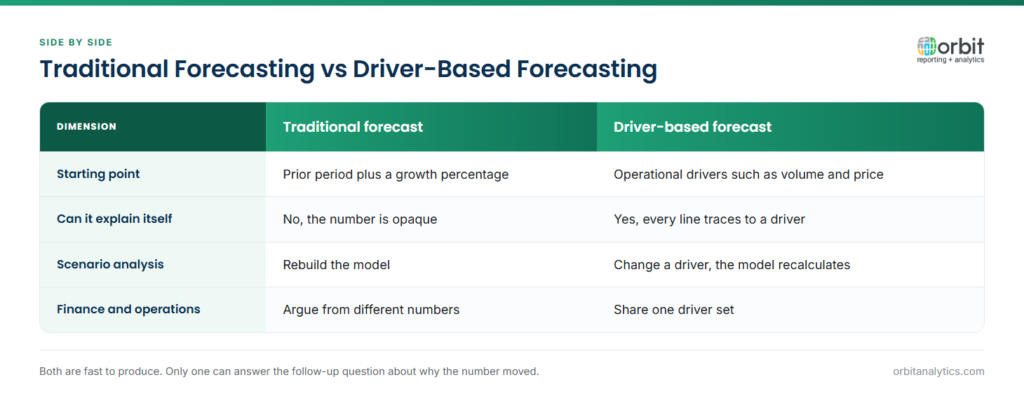
Traditional forecasting starts with the prior period and applies a growth percentage. It is fast but opaque, the forecast cannot explain itself. Driver-based forecasting starts with the operational reality and lets the financial number fall out of the math.
The accuracy gain comes from this transparency. When sales pipeline weakens or attrition rises, the forecast moves automatically. There is no quarter-end scramble to figure out why the actuals diverged from the plan.
Why Do Organizations Need Driver-Based Forecasting?
Three benefits show up consistently:
- Forecast accuracy. The model reflects business mechanics rather than a smoothed historical average, so the forecast tracks reality more closely.
- Faster scenario planning. Changing one driver assumption cascades through the P&L in seconds, which makes “what if” sessions interactive rather than overnight rebuilds.
- Clear cause-and-effect. Leadership stops asking “why is the forecast wrong” and starts asking “which driver moved”.
What Are Business Drivers?
A business driver is an operational metric that materially affects financial performance.
- Revenue drivers: units sold, average selling price, customer count, conversion rate, basket size, billable hours.
- Cost drivers: headcount, raw material cost per unit, freight rate, energy consumption, third-party service spend.
- Operational drivers that flow into finance: utilization rate, on-time delivery, churn, defect rate, supplier lead time.
The right driver set explains roughly 80 percent of the variance in your historical numbers with the fewest variables.
How to Identify Key Business Drivers
Work through three steps in sequence:
- Start with historical correlation. Pull two to three years of monthly actuals and look for operational metrics whose movement tracks revenue or cost most closely.
- Map the value chain. For each unit of revenue, walk backwards through the operational steps that produced it: lead, opportunity, order, shipment, invoice. Each step has a metric, and the points of greatest impact usually sit at conversion or efficiency stages.
- Interview business unit leaders. The sales VP knows which deals close; the ops head knows which lines run hot. Constrain the final list to 5 to 7 drivers per unit, more than that and the model becomes harder to maintain than the spreadsheet it replaced.
Building a Driver-Based Forecasting Model
A driver-based model is built in five steps:
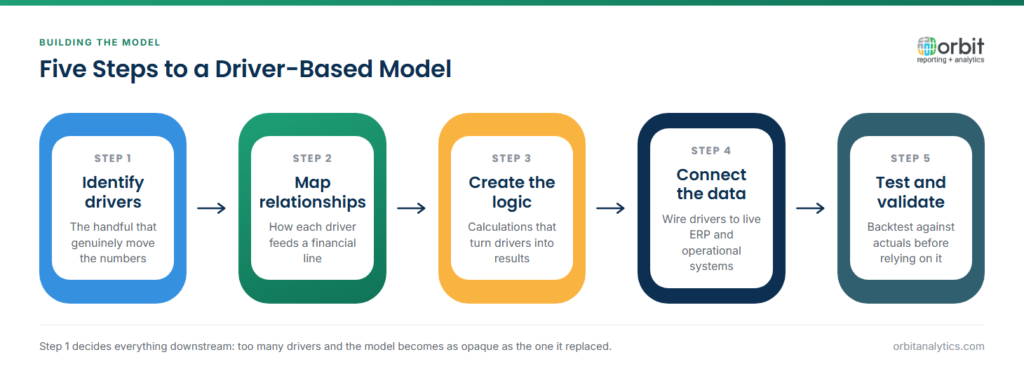
- Identify core drivers. Pick the 5 to 7 drivers per unit that explain most of the financial movement.
- Establish relationships. Document how each driver flows into the P&L. Revenue = units × price. Personnel cost = headcount × loaded rate. Variable cost = volume × unit cost. Keep the math explicit.
- Create calculation logic. Build the formulas in your planning tool. Allow assumption overrides for each driver across base, best, and worst cases.
- Connect to source data. Wire the driver inputs to live operational and financial systems. This is the step that distinguishes a working model from a fragile spreadsheet. Orbit Analytics provides business intelligence for forecasting that pulls operational drivers from Oracle ERP modules, orders from Order Management, headcount from HCM, utilization from Project Accounting, into the same model that holds the financial structure.
- Test and validate. Back-test the model against the last 12 to 24 months of actuals. If the model would not have predicted the past, it will not predict the future.
Driver-Based Forecasting Examples by Industry
Driver sets look different by sector, but the pattern is the same: operational metric in, financial outcome out.
| Industry | Typical Driver Set |
| Manufacturing | Units produced, average price, product mix, yield rate, raw material cost per unit |
| Retail | Store traffic, conversion rate, basket size, gross margin per category, inventory turns |
| SaaS | New users, churn rate, average revenue per user, gross retention, sales cycle length |
| Services | Consultant headcount, utilization rate, billable hour rate, project margin, attrition |
In every case, the financial number is a function of the operational driver, not an independent assumption.
Benefits of Driver-Based Forecasting
The benefits compound once the model is live:
- Improved accuracy. The forecast reflects what is happening in the business rather than a historical average.
- Near-instant what-if analysis. Change a driver, see the P&L move, without rebuilding the workbook.
- Tighter finance-operations alignment. Both sides argue from the same metric set, so reviews focus on action rather than data reconciliation.
- Faster updates. A driver-based model can be refreshed monthly or weekly because the inputs already live in operational systems.
This is where unified operational and financial data pays off. With Orbit Analytics pulling both from Oracle Fusion, EBS, or NetSuite through data management and Fusion analytics, drivers and outputs sit in the same governed environment on the same refresh cadence.
Common Challenges with Driver-Based Forecasting
Three problems recur in practice:
- Picking the right drivers. Too few and the model misses real cost or revenue movers; too many and maintenance overhead kills it within two cycles.
- Data availability. The driver you want, say, weighted pipeline by stage, may not exist as a clean field in any source system.
- Model complexity. A model that needs a dedicated analyst to keep it running every month will not survive a team change.
The fix is to start narrow (one business unit, one P&L, 5 to 7 drivers) and prove the model holds before expanding it.
Best Practices for Driver-Based Forecasting
Four practices separate models that survive from models that get abandoned:
- Keep the model simple. The point is explainability, not completeness.
- Update on a fixed cadence. Monthly for most businesses, weekly for fast-moving ones, built into the close calendar so the refresh never slips.
- Integrate operational and financial data in the same system. A model that depends on three exports and a manual merge will drift within a quarter.
- Validate against actuals every cycle. The drift itself is a signal worth investigating, not a number to suppress.
Frequently Asked Questions
Q1. What is driver-based forecasting in simple terms?
Driver-based forecasting builds financial projections from a small set of operational drivers, units sold, headcount, utilization, instead of from prior-period numbers adjusted by a growth percentage. When a driver moves, the financial forecast updates automatically.
Q2. What is the difference between driver-based and traditional forecasting?
Traditional forecasting starts with last year’s line items and applies a growth assumption. Driver-based forecasting starts with the operational metrics that produce those line items and lets the financial number fall out of the math. The first is faster to build; the second is far more explainable and accurate.
Q3. What are examples of business drivers?
Revenue drivers include units sold, average price, conversion rate, and customer count. Cost drivers include headcount, raw material cost per unit, and freight rate. Operational drivers that flow into finance include utilization, churn, on-time delivery, and supplier lead time.
Q4. What are the benefits of driver-based forecasting?
Better forecast accuracy, faster scenario planning, clearer cause-and-effect between operations and financial outcomes, and tighter alignment between finance and the business units. Updates also become faster because the inputs already live in operational systems.
Q5. How many drivers should a model include?
Aim for 5 to 7 drivers per business unit. More than that and the model becomes harder to maintain than the line-item spreadsheet it replaced. The right set explains roughly 80 percent of historical variance with the fewest variables.
Q6. Can driver-based forecasting be automated?
Yes, and that is where it becomes valuable at scale. When driver inputs are pulled directly from source systems (orders, headcount, utilization) and the financial logic sits in a connected planning model, the forecast refreshes without manual rework.
Ready to move from spreadsheet-driven planning to a live, driver-based model? Request a demo to see how Orbit Analytics connects Oracle ERP operational and financial data into one forecasting environment.
