
Augmented analytics is the use of machine learning and natural language techniques inside a reporting tool to do work an analyst would otherwise do by hand, and the augmented analytics platform page covers the concept in full.
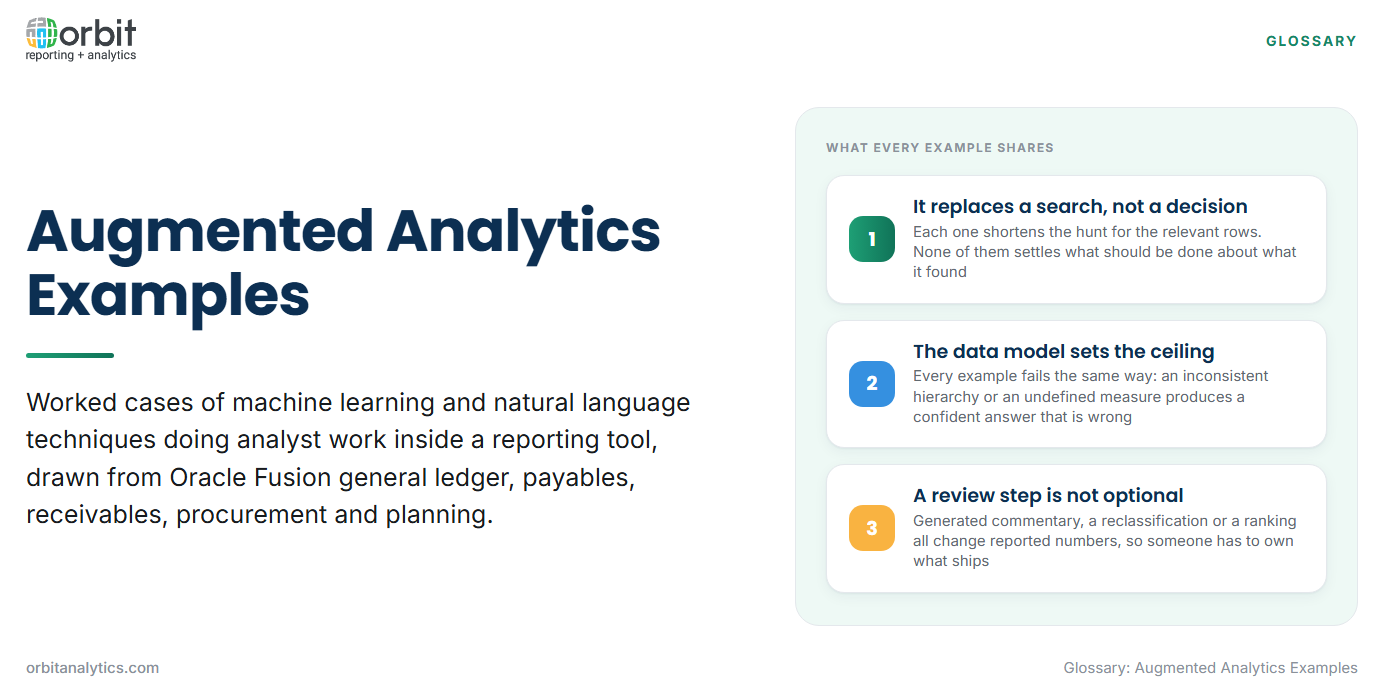
What a definition does not settle is what it looks like on a Tuesday afternoon in a finance team running Oracle Fusion. The eight augmented analytics examples below all come from that setting: general ledger, payables, receivables, procurement and planning.
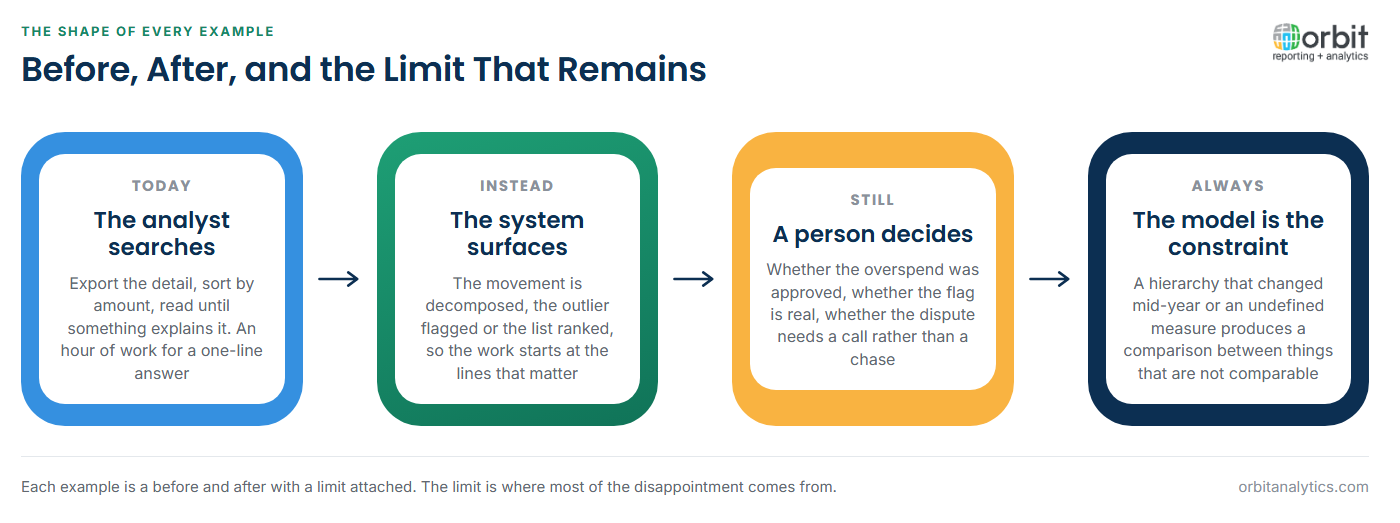
Each is written as a before and after: what the analyst does today, what the system surfaces instead, and what it still cannot tell anyone. That last part is where most disappointment comes from.
One thread runs through all of them. Each replaces a search, not a decision, and each fails the same way when the data model is inconsistent.
Variance Explanation at Period End
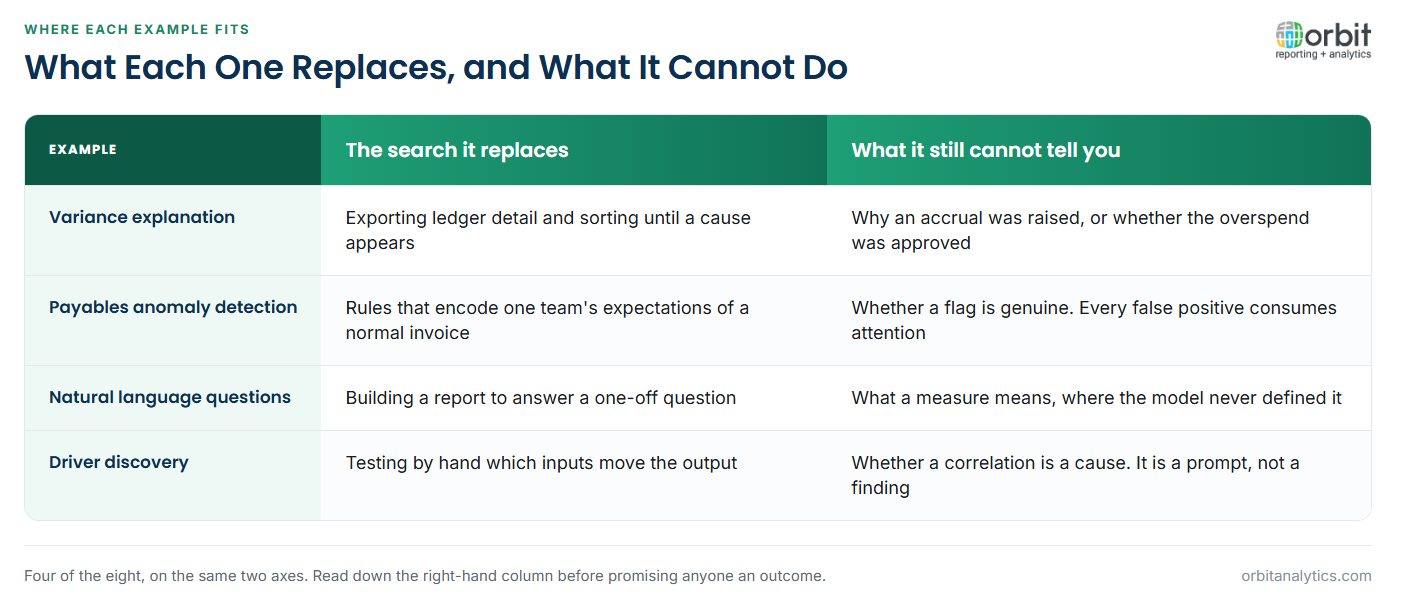
Today an analyst sees an unfavourable variance on a cost centre, exports the ledger detail, and sorts by amount until something explains it. An hour of work for a one-line answer.
Augmented variance explanation decomposes the movement automatically, ranking the accounts, cost centres and entities that contributed most. The analyst starts with the three lines that matter rather than finding them.
It cannot say why the accrual was raised or whether the overspend was approved. It needs consistently mapped account hierarchies and a stable cost centre structure; if the hierarchy changed mid-year, the decomposition compares things that are not comparable.
Anomaly Detection in Payables
Payables teams look for two problems, and rules catch only part of each.
- Duplicate and near-duplicate invoices: The same invoice entered twice with a different reference, a transposed number, or a trailing character. Exact-match rules miss the near-duplicates, which are the expensive ones.
- Amounts that break a supplier’s own pattern: A supplier billing a steady monthly amount for two years submitting something several times larger. No fixed threshold catches this, because the same amount is unremarkable from a larger supplier.
Rules miss both because they encode one team’s expectations rather than what each supplier actually does. A model learns the per-supplier pattern and flags departures from it.
The honest cost is the false positive. Every flag consumes attention, and a detector tuned too tightly buries genuine exceptions in noise, which is how these programmes get switched off.
Natural Language Questions Against the Ledger
A controller asks for gross margin by region and gets a number without anyone building a report. That is the demonstration everyone has seen.
What decides whether the number is right is the semantic model, not the language parsing. The system has to know which accounts constitute gross margin in this chart of accounts, which dimension carries region, and which period convention applies. Where those are undefined, the answer is confidently wrong, which is worse than no answer.
Ambiguity is where it breaks down: revenue can mean gross or net, region can mean legal entity or sales territory. Orbit Analytics addresses this by defining those terms once in a governed model over live Oracle Fusion and EBS data, so the same question returns the same figure whoever asks it. Good looks like a system that shows the definition it used, and says so when it does not know.
Automated Narrative on a Management Pack
Every management pack has commentary. Someone writes that revenue rose against a stronger prior period, driven by two regions, with one offsetting decline. Generated narrative writes that sentence from the figures the chart already uses, which helps most on the descriptive layer: what moved, by how much, against what comparator, across dozens of cost centres nobody has time to write up.
Anything causal has to be reviewed. Generated text will say a movement was driven by a segment when all it knows is that the segment is the largest contributor, which is not the same claim. Thresholds matter too: a system calling every small movement significant trains readers to skip the commentary.
Driver Discovery in Forecasting
Forecast models are usually built from the drivers a team already believes in. Driver discovery tests which inputs actually move the output across the available history, and sometimes proposes one nobody modelled.
This is closely related to driver-based forecasting, where drivers are chosen deliberately. The augmented version proposes candidates; the deliberate version decides which belong in the plan.
The trap is correlation presented as explanation. A discovered relationship is a prompt to investigate, not a finding, and treating the ranking as a conclusion builds fragile forecasts. It also needs years of consistent history, which restructurings and migrations break.
Receivables Collection Prioritisation
Collectors work a list. Ranking it by which accounts are most likely to pay late puts effort where it changes an outcome, rather than working strictly by balance or age.
| Signal | What it indicates |
| Historical days to pay | The customer’s own payment behaviour, not the agreed terms |
| Recent payment trend | A deterioration that precedes a formal problem |
| Dispute and credit note history | Friction that delays payment for reasons collection calls cannot fix |
| Invoice size against the account’s norm | A payment likely to need approval on the customer’s side |
Collectors use the ranking as a work order, not a verdict. An important customer in a genuine dispute is handled by a conversation, whatever the model says.
Data Preparation and Spend Classification
These two belong together, because both operate below the reporting layer, on the data itself.
- Join and quality suggestions. When two datasets are brought together, the system proposes how they relate, identifies candidate keys, and flags problems first: a column that is mostly null, a date field holding two formats, a supplier name spelled four ways. The least visible example here and often the most useful, because it removes the rework that makes a first analysis wrong.
- Spend classification in procurement. Purchase lines carry free-text descriptions, and category trees decay as new suppliers and items arrive. Classifying those descriptions automatically restores a spend report that had quietly stopped being accurate.
Both need a review loop. Reclassification changes reported numbers, so a category change nobody sanctioned reads as a data error next month.
What These Examples Have in Common
Three properties run through all eight, and together they test any capability a vendor demonstrates.
- Each replaces a search, not a decision. The system narrows thousands of rows to a handful. A person still decides what to do, and the accountability does not move.
- Each depends on a defined model. Account hierarchies, dimension meanings, supplier masters and category trees decide whether the output is correct. The technique is the easy part.
- Each needs a human review step. Flagged, suggested and generated output is input to judgement, not a conclusion.
The weakest link is always the data. Inconsistent hierarchies, duplicated master records and dimensions meaning different things in different modules defeat every example above, which is why augmented analytics work starts with the data foundation. Orbit Analytics supplies that foundation with 200+ pre-built connectors across Fusion Cloud, EBS, NetSuite and non-Oracle sources, so these techniques run on complete data rather than one module’s view.
Frequently Asked Questions
Q1. What is an example of augmented analytics?
Automatic variance decomposition at period end is a clear one. Rather than an analyst exporting ledger detail to find what moved, the system ranks the accounts and cost centres contributing most to the variance. The analyst still decides what it means.
Q2. Does augmented analytics replace analysts?
No. Every example here replaces a search rather than a judgement. The techniques narrow a large dataset to a short list, and a person still interprets it, decides on action and carries the accountability.
Q3. What data does augmented analytics need to work?
Consistent structure, mainly: hierarchies that did not change mid-year, dimensions meaning the same thing across modules, deduplicated supplier and customer masters, and enough history for patterns to exist.
Q4. Why do natural language queries return the wrong number?
Usually because a business term is undefined or ambiguous in the semantic model. If revenue can mean gross or net, the system resolves the ambiguity silently and answers a different question from the one asked.
Q5. Can augmented analytics work on Oracle Fusion data?
Yes, and the examples here come from Fusion general ledger, payables, receivables and procurement workflows. The constraint is rarely the technique; it is whether the data has been modelled consistently enough to trust the output.
These examples earn their effort only when the data beneath them is consistent across modules and systems. Orbit Analytics gives Oracle finance teams a governed reporting layer over live Fusion Cloud and EBS data, with drill-down from any figure to the transactions behind it. Request a demo to see it against your own ledger.
