
AI forecasting is the use of machine learning models to predict future values, such as sales, cash or demand, by learning patterns from historical data and the drivers that influence it. Instead of applying a formula someone specified in advance, the model works out from the data which relationships matter and how strongly.
AI forecasting is the time-series branch of predictive analytics. Predictive analytics covers any prediction from data, such as which customer is likely to churn; AI forecasting is specifically about how a measured quantity will move over future periods.
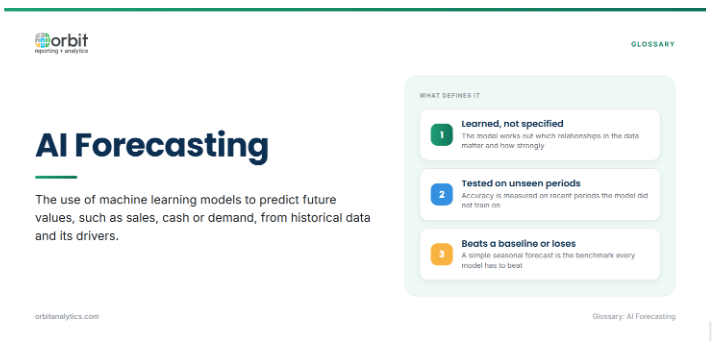
The term is broad. It covers anything from a gradient-boosted model predicting weekly demand to an automated system that tests dozens of models and picks the best one for each product.
How AI Forecasting Works
An AI forecast is produced by a repeating cycle rather than a single calculation:
- Collect history and drivers: gather past values of the target, plus the factors that move it, such as prices, promotions, headcount, orders or seasonality.
- Prepare features: turn raw data into model inputs, such as lagged values, rolling averages, calendar flags and driver values aligned to the same period.
- Train candidate models: fit several models on the history so each learns the relationship between the features and the target.
- Test on held-out periods: compare forecasts against recent periods the models did not see during training, and keep the one that performs best.
- Forecast, monitor and retrain: publish the forecast, track its error as actuals arrive, and retrain when accuracy drops or the business changes.
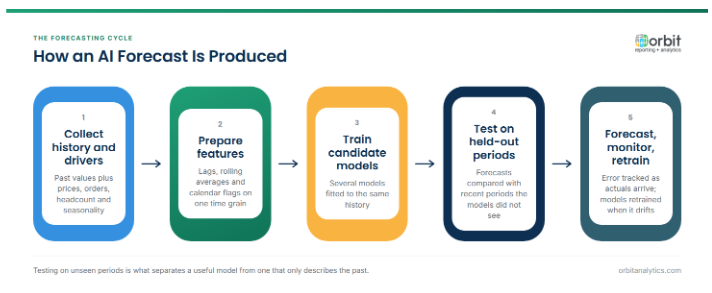
The testing step is what separates a useful model from one that only describes the past. A model can fit history closely and still forecast poorly.
Common AI Forecasting Methods
Several families of method are in common use:
| Method | How it works | Typical fit |
|---|---|---|
| Gradient-boosted trees | Many small decision trees combined, each correcting the errors of the last | Tabular data with many drivers, such as demand by product and store |
| Neural networks | Layered models, including recurrent and transformer designs, that learn sequences | Large datasets with many related series |
| Automated model selection | Software tests many models per series and picks or blends the best | Thousands of series where hand-tuning is impractical |
| Statistical baselines | Exponential smoothing, ARIMA and seasonal naive forecasts | Short or stable series, and as the benchmark every AI model must beat |
The baseline row matters. If a complex model cannot beat a simple seasonal forecast on held-out data, the simpler model is the better choice.
What Data AI Forecasting Needs
Model choice usually matters less than the data the model is given:
- Enough history: at least two full seasonal cycles, such as two years of monthly data, so the model can tell seasonality from trend.
- Consistent granularity: every series at the same grain, such as daily by store or monthly by cost center, without gaps or changes in definition.
- Internal and external drivers: prices, orders, pipeline and headcount from internal systems, and where relevant external signals such as holidays, weather or economic indicators.
- Clean master data: products, customers and accounts mapped consistently over time, so a reorganization does not look like a collapse in demand.
For Oracle ERP data, the work often starts with moving history out of the transactional system. Orbit Analytics provides a data pipeline that moves Oracle Fusion Cloud and EBS data into platforms such as Snowflake and Databricks, where forecasting models are typically trained.
AI Forecasting Use Cases
AI forecasting is most often applied where history is rich and decisions are frequent:
- Cash flow: predicting receipts and payments from accounts receivable, accounts payable and general ledger history, so treasury can plan funding and investment.
- Revenue and demand: forecasting orders by product, customer or region to guide inventory, production and sales targets.
- Expenses and workforce: projecting spend and headcount needs from hiring plans, seasonality and activity levels.
- Anomaly detection: flagging actuals that fall well outside the forecast range, which often signals a data error or an operational issue.
Orbit Analytics adds augmented analytics on top of reporting, using machine learning for pattern detection, anomaly identification and trend prediction from historical data, so these signals appear where finance and operations teams already work.
Measuring Forecast Accuracy
A forecast is only as good as its measured error. Common measures include:
- MAPE and WAPE: mean absolute percentage error averages the percentage miss per period; weighted absolute percentage error weights it by volume, which avoids distortion from small values.
- Bias: whether the forecast is consistently too high or too low. A small average error can hide a persistent bias.
- Forecast value added: how much a method improves on a simple baseline. If an AI model adds nothing over a seasonal naive forecast, it is not earning its complexity.
Limits and Risks of AI Forecasting
AI forecasting has real limits, and they are well documented:
- Explainability: complex models can be hard to explain to a CFO or a board, which slows adoption even when the numbers are better.
- Structural breaks: a pandemic, an acquisition or a pricing change makes history a poor guide, and models trained on it can be confidently wrong.
- Short or noisy history: new products and new entities have too little data for machine learning to outperform simple methods.
- Data leakage: using information that would not have been known at forecast time, such as final period figures, makes test accuracy look far better than real performance.
AI Forecasting vs Traditional Forecasting
AI forecasting does not replace the other methods finance teams use. Each fits a different situation:
| Approach | Basis | Best suited to |
|---|---|---|
| Judgment-based | Experience of managers and sales teams | New products, one-off events, strategic changes |
| Statistical | Trend and seasonality in the series itself | Stable series with limited drivers |
| Driver-based forecasting | Explicit business drivers and formulas set by finance | Planning and scenarios where the logic must be visible |
| AI forecasting | Patterns learned from history and many drivers | High-volume, data-rich forecasts that are refreshed often |
Many teams combine them: an AI baseline for volume forecasts, adjusted by driver-based assumptions and management judgment where the business is changing.
Frequently Asked Questions
Q1. How accurate is AI forecasting?
It depends on the data and the series. On data-rich, stable series it often beats simple methods, while on short or disrupted series it may not. Accuracy should always be measured against a baseline on periods the model has not seen.
Q2. What length of history does AI forecasting need?
As a rule of thumb, at least two full seasonal cycles, such as two years of monthly data. More history helps only if the business it describes is still comparable to today.
Q3. Is AI forecasting the same as predictive analytics?
It is a subset. Predictive analytics covers any prediction from data, while AI forecasting predicts how a quantity will move over future time periods.
Q4. Can AI forecasting replace driver-based planning?
Not usually. AI is strong at projecting volumes from history, while driver-based planning makes business assumptions explicit for scenarios and targets. Most finance teams use both.
Q5. Why do AI forecasts fail?
The common causes are poor or inconsistent data, structural changes the history does not reflect, data leakage during testing, and no ongoing monitoring once the model is in use.
AI forecasting depends on clean, consistent history from the systems of record. Orbit Analytics connects Oracle Fusion Cloud and EBS data to analytics and data platforms, so forecasts start from governed figures. Request a demo to see it on your own data.
