
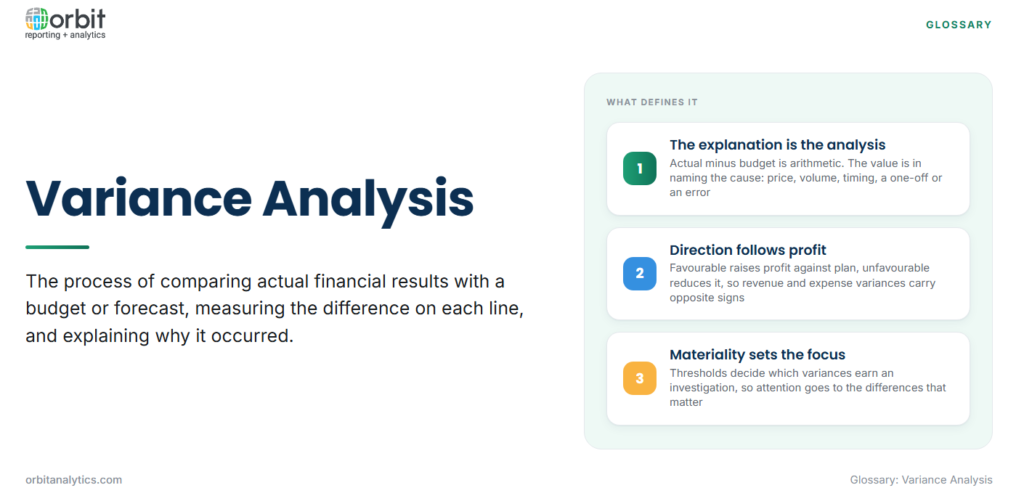
Variance analysis is the process of comparing actual financial results with a budget or forecast, measuring the difference on each line, and explaining why it occurred. The variance itself is simple arithmetic: actual minus budget. The analysis is the explanation, which turns a number into something a manager can act on.
The core comparison in most finance teams is budget versus actual, run monthly after the books close. Revenue came in lower than planned, or travel spend came in higher: variance analysis asks whether that was caused by price, volume, timing, a one-off event or an error, and whether it will repeat.
Why Variance Analysis Matters
A budget without variance analysis is a forecast nobody checks. The comparison does three things:
- Early warning on performance: a margin slipping by a small amount each month is visible in the variance report long before it shows up as a missed year.
- Accountability for budget owners: each department head explains the variances on their own lines, which ties spending decisions to the people who made them.
- Better forecasts next time: understanding why last month’s numbers missed is the most direct way to improve next month’s estimate.
Favourable and Unfavourable Variances
A variance is favourable when it increases profit compared with the plan and unfavourable (or adverse) when it reduces it. That is why the signs differ by line type: revenue above budget is favourable, while an expense above budget is unfavourable.
A favourable variance is not always good news. Maintenance spending well under budget may mean repairs were postponed, and revenue well above plan may reflect a pricing error or a one-off order that will not recur. Every material variance deserves an explanation, whichever direction it runs.
The Main Types of Variance
Variances are grouped by the line of the P&L they affect and, for manufacturers, by the element of standard cost:
- Revenue variances: the difference between actual and budgeted sales, usually split into price, volume and mix.
- Expense variances: the difference on operating lines such as salaries, rent, marketing and travel.
- Labour rate and efficiency variances: whether a difference in labour spend came from paying a different hourly rate or from using more or fewer hours than planned.
- Material price and usage variances: whether materials were bought at a different price or consumed in a different quantity than the standard allows.
- Overhead variances: differences in indirect production spending, split into spending and volume effects.
Price, Volume and Mix Variance
The most useful decomposition of a revenue or margin variance separates what was charged from how much was sold:
- Price variance = (actual price − budget price) × actual units
- Volume variance = (actual units − budget units) × budget price
- Mix variance applies when there is more than one product: it measures the effect of selling a different proportion of high-margin and low-margin items than planned, holding total units constant.
A single-product example shows how the pieces add up. The budget was 10,000 units at 50, or 500,000. The business actually sold 9,000 units at 54, or 486,000.
| Component | Calculation | Variance | Direction |
|---|---|---|---|
| Price variance | (54 − 50) × 9,000 | 36,000 | Favourable |
| Volume variance | (9,000 − 10,000) × 50 | (50,000) | Unfavourable |
| Total revenue variance | 486,000 − 500,000 | (14,000) | Unfavourable |
The headline says revenue missed by 14,000. The decomposition says something more useful: the price increase held, but it cost 1,000 units of volume, and that trade-off is now a question for the commercial team.
How to Perform Variance Analysis
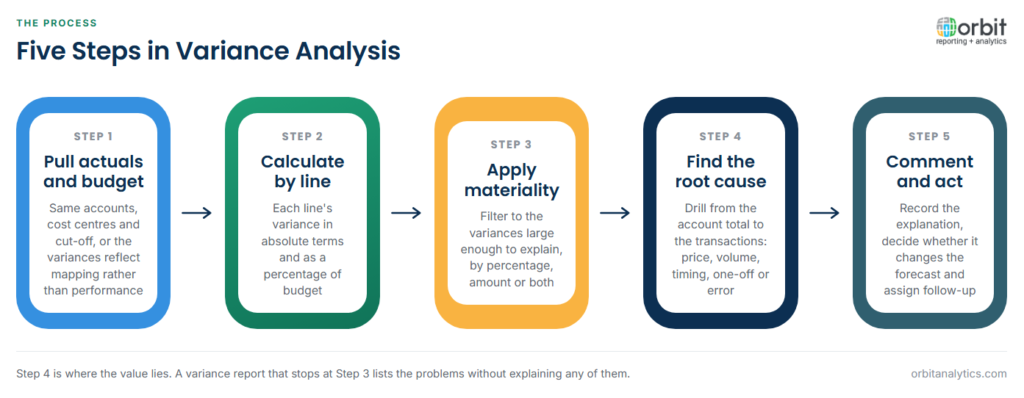
- Pull actuals and budget for the same period. Both must use the same accounts, cost centres and period cut-off, or the variances will be artefacts of mapping rather than performance. Orbit Analytics pulls GL actuals and budget balances side by side from Oracle, which removes the manual export step where those mismatches usually creep in.
- Calculate variances by line. Show each line in absolute terms and as a percentage of budget.
- Apply materiality thresholds. Filter to the variances large enough to explain, so attention goes where it matters.
- Find the root cause. Drill from the account total into the transactions and ask whether the cause is price, volume, timing, a one-off or an error.
- Write commentary and act. Record the explanation, decide whether it changes the forecast, and assign any follow-up.
Materiality Thresholds: Which Variances to Investigate
Explaining every variance on every line wastes the month, so most teams set thresholds that decide which ones need commentary:
- Percentage thresholds: investigate any line more than a set percentage from budget. This catches problems on small lines but flags trivial amounts.
- Absolute amount thresholds: investigate any variance above a set currency amount. This focuses on large lines but misses a small line that has doubled.
- Combining the two: the common practice is to require both, for example more than 10% and more than a fixed amount, so a variance must be proportionally and financially significant before it earns an explanation.
The thresholds themselves are a policy choice, set by the controller or CFO and often tightened for sensitive lines such as revenue and headcount.
Variance Analysis on Oracle GL Actuals vs Budget
In Oracle Fusion Cloud and Oracle EBS, actuals and budgets can both sit in the general ledger as separate balance types, which makes budget versus actual a natural ledger report. The difficulty is usually the next step: moving from a variance on a summary account to the journals that caused it, then keeping the explanation next to the number.
Orbit Analytics provides general ledger reporting that reads Oracle actual and budget balances directly, with drill-down from any variance to the journal lines behind it. Teams that prefer to write commentary in a workbook can use Excel reporting that refreshes live ledger data into the sheet rather than relying on pasted exports.
Budget Variance vs Forecast Variance
A budget variance measures actuals against the original annual plan. It answers the accountability question: did the business deliver what it committed to at the start of the year?
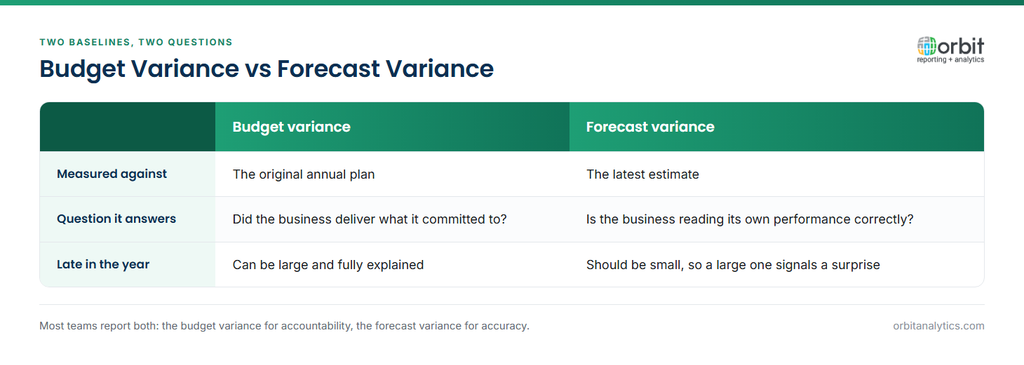
A forecast variance measures actuals against the latest estimate, which has already absorbed what was known last month. It answers the accuracy question: is the business reading its own performance correctly? The distinction between an estimate and a plan is explored further in forecast vs projection.
Most teams report both. Late in the year the budget variance can be large and fully explained, while a large forecast variance points to something nobody saw coming.
Frequently Asked Questions
Q1. What is variance analysis?
Variance analysis compares actual results with a budget or forecast, line by line, and explains the cause of each material difference. Its purpose is to turn a difference into a decision, not just to report it.
Q2. What is a favourable variance?
A favourable variance is one that increases profit compared with plan: revenue above budget or expenses below it. It still needs explaining, because a favourable result can reflect deferred spending or a one-off gain.
Q3. What is the difference between price, volume and mix variance?
Price variance measures the effect of charging a different price, and volume variance the effect of selling a different quantity. Mix variance measures the effect of selling a different proportion of products than planned, with total units held constant.
Q4. What is a materiality threshold in variance analysis?
It is the size a variance must reach before it requires investigation and commentary, usually set as a percentage of budget, an absolute amount or both. Thresholds keep the analysis focused on differences that matter.
Q5. How often should variance analysis be done?
Most finance teams run it monthly, straight after the period-end close. High-risk lines such as revenue, cash and headcount are often monitored more frequently.
Variance analysis is only as fast as the path from a variance to its cause. Orbit Analytics connects live Oracle GL actuals and budgets with drill-down to the journal, so commentary starts from evidence. Request a demo to see it with your own ledger.
