
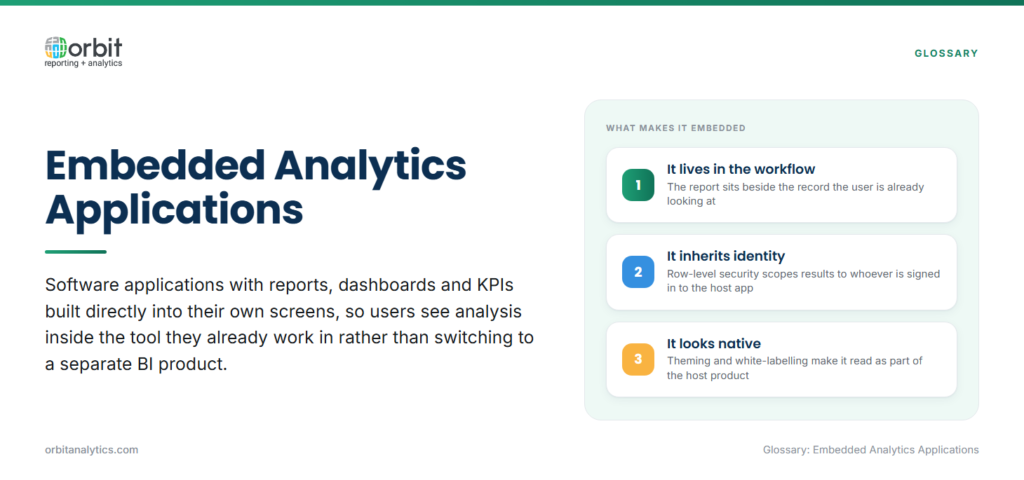
Embedded analytics applications are software applications with reports, dashboards, and KPIs built directly into their own screens, so users see analysis inside the tool they already work in rather than switching to a separate BI product.
The distinction from a standalone dashboard is where the insight appears. A standalone dashboard is a destination somebody has to decide to visit. An embedded report sits in the workflow, next to the record the user is already looking at, which is why it gets read.
The vocabulary is unusually loose here. Embedded analytics, embedded BI, embeddable BI, and embedded reporting all name the same idea from slightly different angles: embedded BI describes the capability, embeddable BI describes a platform built to be embedded by someone else, and embedded reporting usually means the narrower case of fixed reports rather than interactive analysis.
Why Embedded Analytics Applications Matter
- Insight arrives inside the workflow. A buyer reviewing a purchase order sees supplier performance on the same screen, not after opening a second tool.
- Context drives adoption. Analytics presented where a decision is already being made gets used far more consistently than a portal a user has to remember to open.
- Fewer report requests in the IT backlog. Common questions are answered by content already embedded, so the queue shortens without anyone building anything new.
- Faster operational decisions. Removing the context switch removes hours from routine calls about inventory, credit, or backlog.
Key Components of an Embedded Analytics Application
Four layers have to work together, and a weakness in any one of them shows up as a slow or untrustworthy report.
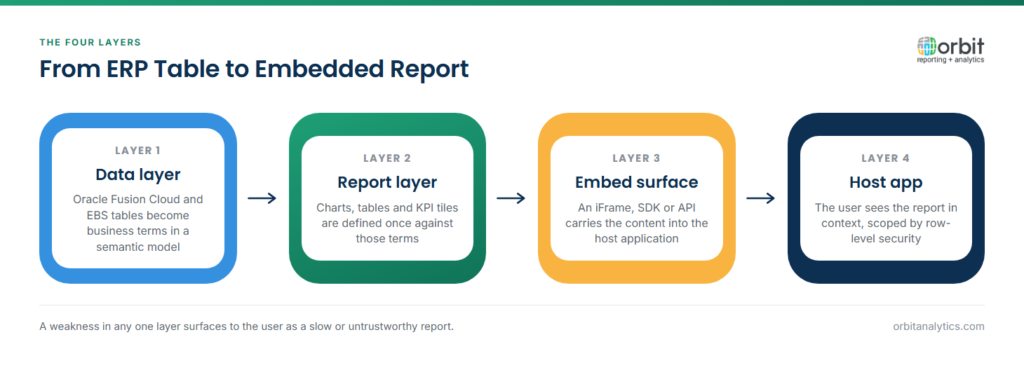
- The data layer and semantic model: Where source tables become business terms, so a report refers to “net revenue” rather than a column name.
- The report and visualization layer: The charts, tables, and KPI tiles themselves, plus whatever interactivity the user gets.
- The embedding method: An iFrame for speed of delivery, a JavaScript SDK for deeper control of look and behaviour, or an API when the host application wants to render the visuals itself.
- Security and white-labeling: Row-level access so each user sees only their own data, and theming so the embedded content reads as part of the host product.
Deeper architectural treatment of these layers sits in embedded analytics architecture.
Types of Embedded Analytics Content
Not all embedded content is a dashboard, and matching the type to the user matters more than the volume of it:
- Operational and transactional reports: Fixed layouts answering a recurring question, such as open orders by warehouse or aged receivables.
- Self-service and ad hoc analysis: A constrained query surface letting users build their own view within governed boundaries.
- KPI widgets and contextual insights: Single figures placed beside a record, showing the one number relevant to what the user is doing.
- Alerts and scheduled distribution: Content that reaches the user rather than waiting to be opened, delivered on a threshold or a schedule.
Embedded Analytics Applications in Oracle ERP Environments
In an Oracle estate, the practical question is how much modelling work sits between raw ERP tables and a usable embedded report.
OTBI covers standard transactional reporting inside Fusion Cloud well, and for single-pillar operational questions it is often enough. Its scope ends at export ceilings, fixed subject areas, and single-source reporting, so blending Fusion data with EBS, a warehouse, or a non-Oracle system falls outside it. Refresh is the other decision: operational embedded content usually needs live reads against the ERP, while heavier analytical content is better served on a schedule.
Orbit Analytics surfaces live Oracle Fusion Cloud and EBS data inside applications through 200+ pre-built connectors and 1,000+ pre-built reports, so an embedded report can be running against correctly joined ERP data in days rather than after a modelling project.
Common Use Cases for Embedded Analytics Applications
| Setting | What gets embedded |
| Production and manufacturing | Output, scrap, and downtime by line, shown inside the shop-floor application |
| Survey and feedback programs | Response rates and score trends inside the survey tool itself |
| Finance, procurement, supply chain | Spend against budget, supplier performance, inventory cover next to the transaction |
| Customer and partner portals | Each customer’s own usage, orders, or entitlement data, branded as the host product |
The last row is the demanding one, because external users make tenant isolation and branding non-negotiable. Orbit Analytics provides Oracle-native embedded reporting that reads Fusion and EBS schemas out of the box, which is what makes operational and customer-facing deployments practical rather than long projects.
Common Challenges With Embedded Analytics Applications
- Data modelling and governance debt: Embedding a report built on an undocumented model spreads the problem to every user of the host application.
- Query performance at scale: Content that is fast for one analyst can be slow for two thousand concurrent users hitting it inside an application.
- Consistency of the embedded experience: Mismatched fonts, colours, and interaction patterns make embedded content read as bolted on, and users trust it less.
- Low adoption when content ignores the workflow: A technically perfect dashboard placed on a screen where nobody needs it goes unused.
Best Practices for Embedded Analytics Applications
- Start with high-value workflows. Pick the two or three screens where a decision is made repeatedly, and embed there first.
- Plan modelling and governance early. Decide what a metric means and who may see which rows before embedding, not after users disagree.
- Match content to the role. An operations supervisor needs a fixed view; an analyst needs a query surface. Giving either the other one wastes the effort.
- Measure adoption and iterate. Track which embedded content is actually opened, and retire what is not.
Embedded Analytics Applications vs. Adjacent Approaches
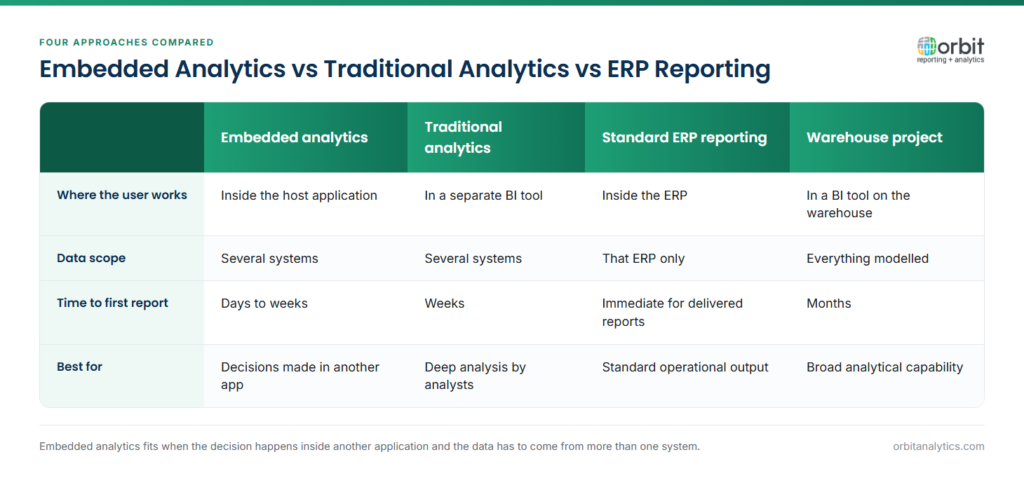
Traditional analytics separates the tool from the work, which costs a context switch but keeps analytical depth in one place. Standard ERP reporting sits inside the ERP already, but stops at that ERP’s own data. A warehouse project delivers the broadest analytical capability and the longest timeline. Embedded analytics fits when the decision happens inside another application and the data has to come from more than one system.
Frequently Asked Questions
Q1. What are embedded analytics applications in simple terms?
They are applications with reports and dashboards built into their own screens. Instead of leaving to open a BI tool, the user sees the relevant analysis beside the work they are already doing.
Q2. What is the difference between embedded reports and a standalone dashboard?
A standalone dashboard is a separate destination the user has to choose to visit. An embedded report appears inside the application where the work happens. The analysis can be identical; the difference is placement, and placement is what drives whether it gets used.
Q3. How do you embed analytics into an application?
Through one of three methods: an iFrame, which is fastest to deploy; a JavaScript SDK, which gives control over appearance and interaction; or an API, where the host application receives data and renders its own visuals. Each trades delivery speed against control.
Q4. How does embedded analytics differ from Oracle OTBI?
OTBI is Fusion Cloud’s built-in reporting, strong for standard transactional reports on Fusion data. A broader embedded layer is added when reporting needs to cross sources, exceed OTBI’s export limits, or appear inside an application other than Fusion.
Q5. Is embedding analytics secure with row-level access controls?
Yes, when the security model is enforced in the data layer rather than the interface. The embedded report inherits the user’s identity, and row-level rules restrict results before they are returned, which is essential for customer-facing deployments.
Q6. Does embedded analytics replace a separate BI tool or a data warehouse?
Usually not. It changes where content is consumed, not whether a modelled data layer is needed. Many organizations keep a BI tool for deep analysis and embed a governed subset where operational decisions are made.
Embedded analytics works when the data underneath it is already joined and governed, which is the part Oracle estates find hardest. Request a demo to see how Orbit Analytics embeds live Oracle Fusion Cloud and EBS reporting inside the applications your teams already use.
