
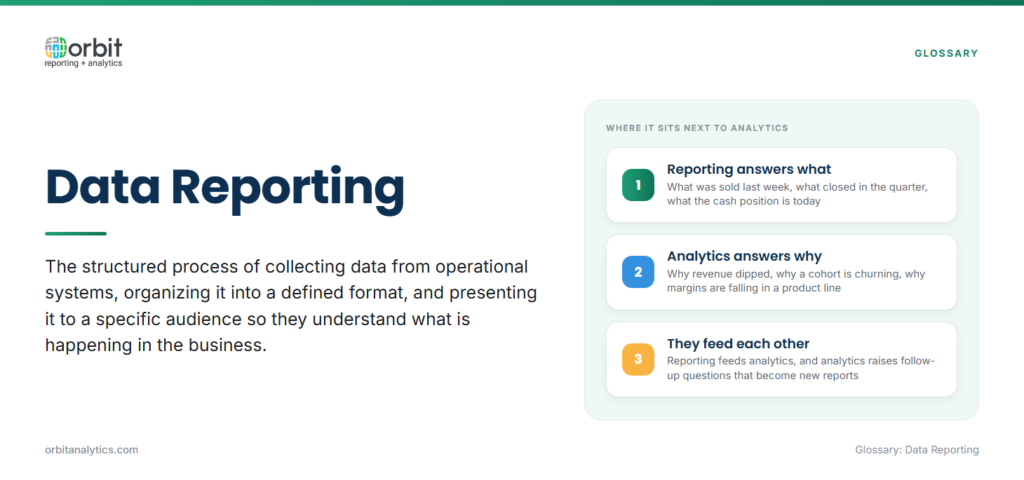
Data reporting is the structured process of collecting data from operational systems, organizing it into a defined format, and presenting it to a specific audience so they understand what is happening in the business. Reports answer the “what”: what was sold last week, what closed in the quarter, what is the cash position today, what slipped against forecast.
That distinguishes it from data analytics. Analytics asks “why”, why revenue dipped, why a cohort is churning, why margins are falling in a product line. Reporting feeds analytics, and analytics surfaces follow-up questions that become new reports. Done well, data reporting is the foundation of data-driven decisions: a finance team cannot manage cash without a reliable cash report, and a sales leader cannot allocate territory without a clean pipeline view.
Why is Data Reporting Important for Businesses?
Three outcomes make reporting indispensable:
- Visibility into performance. Consolidated reports across finance, sales, and operations give leaders a shared picture they can act on.
- Accountability. When targets are reported on a fixed cadence, teams own their numbers and slippage is identified early.
- Trend and anomaly identification. Patterns emerge when data is reported consistently over time, which is also how outliers get caught before they become problems.
For Oracle ERP shops, reporting also surfaces data in Fusion Cloud, EBS, or NetSuite that would otherwise stay hostage to power users who can write OTBI or BIP queries.
Key Types of Data Reports
Most enterprise reporting falls into four buckets, each with a different audience, format, and refresh expectation:
| Report type | Audience | Examples | Refresh cadence |
| Operational | Line managers | Open orders, daily sales, production output, AR aging | Hourly to daily |
| Analytical | Analysts, FP&A | Variance analysis, cohort behavior, root-cause breakdowns | Weekly or on-demand |
| Strategic | Executives, board | Board packs, monthly business reviews, quarterly forecasts | Monthly or quarterly |
| Regulatory | Auditors, regulators | Statutory financials, tax filings, SOX walkthroughs | Statutory cadence |
Treating all four as the same problem is a common mistake. An operational report should be fast and refreshed often; a regulatory report should be exact, pixel-perfect, and reproducible years later. Mixing the formats usually fails one constituency or the other.
Components of Effective Data Reports
Four ingredients separate reports people use from reports that get built once and ignored:
- Clear objectives and defined audience. A report for “everyone” serves no one. Name the role and the decision first.
- Relevant metrics and KPIs. Pick a small set that maps to the audience’s decisions, not every measure someone asked for six months ago.
- Appropriate visualization. A table is right for detail, a line chart for trend, a scorecard for executive summary.
- Context. A number on its own is useless without a target, prior period, or benchmark to compare against.
This is where Orbit Analytics earns its place in Oracle environments: 1,000+ pre-built reports and KPIs mapped to seeded Fusion Cloud and EBS schemas, so teams do not burn a quarter modeling basics like AR aging or cash position before publishing anything useful.
Benefits of Data Reporting
A well-run reporting practice produces four compounding benefits:
- Better decision-making. Operators and executives see the same numbers, so debates move from “whose number” to “what action”.
- Operational efficiency. Anomalies surface earlier, cutting the cost of late corrections.
- Cross-team communication. Every function speaks from the same definitions, removing reconciliation work that wastes review meetings.
- Foundation for advanced analytics. You cannot build a forecasting model on data you cannot reliably report on.
Common Challenges in Data Reporting
Most reporting practices stumble on the same problems:
- Data silos and integration. ERP, CRM, HR, and operational systems each hold a piece of the truth, and without a unified data pipeline, every cross-system report becomes a one-off project.
- Report proliferation. Hundreds of reports, most unused or stale, consume more time than building new ones.
- Balancing detail with clarity. The same data has to serve executives who want a one-page summary and analysts who want detail.
The fix is structural: a governed catalog that retires unused reports, a single source of truth, and a platform that supports summary and detail from the same model.
Data Reporting by Business Function
Each function has a core reporting backbone. Mapping these is the fastest way to scope a new platform rollout:
| Function | Core reports |
| Finance | P&L, balance sheet, cash flow, AR/AP aging, trial balance |
| Sales | Pipeline by stage, revenue by segment, win rate |
| Marketing | Campaign performance, attribution |
| Operations | Inventory turns, production output, on-time delivery |
Data Reporting Best Practices
Four practices keep a reporting program from drifting into sprawl:
- Define reporting requirements before you build. Pin down audience, cadence, metrics, and format before anyone opens the report builder.
- Establish single sources of truth. Every report should pull from the same underlying data, even when consumers see different views.
- Automate wherever possible. Manual spreadsheet refreshes are the single biggest source of errors and the first thing to remove.
- Actively retire unused reports. A report nobody opened in six months is technical debt, not an asset; build a quarterly cleanup into the cadence.
How to Get Started with Data Reporting
A reliable rollout follows four sequential steps:
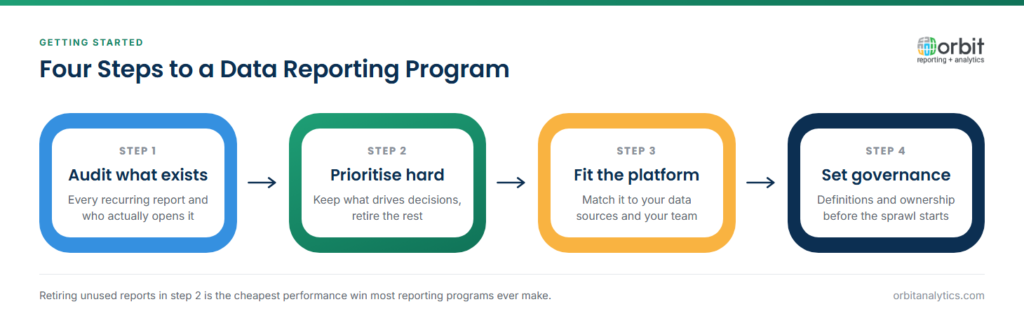
- Audit what you have. List every report your teams produce, the audience, the cadence, and the system it’s built on. Most organizations are shocked at how much duplication shows up in that inventory.
- Prioritize ruthlessly. The 10-15 reports that genuinely run the business get rebuilt first; the rest go on a “review later” list and quietly die.
- Choose a platform that fits your data and team. For Oracle ERP shops, Orbit Analytics ships as a comprehensive Oracle reporting platform with paginated, interactive, and self-service operational reporting on Fusion Cloud or EBS data, plus 200+ connectors so non-Oracle sources land in the same model.
- Set up governance early. Decide who owns metric definitions, how new reports get approved, how old ones get retired, and how data quality issues get escalated. Without governance, even a great platform devolves into sprawl.
Frequently Asked Questions
Q1. What is data reporting in simple terms?
Data reporting is the practice of pulling information out of operational systems, organizing it into a defined format, and presenting it so business teams can understand what is happening. It covers everything from a daily sales summary to a quarterly board pack, anything that turns raw data into a document or dashboard people make decisions on.
Q2. What is the difference between data reporting and data analytics?
Reporting answers “what”, what happened, what’s happening now, what’s tracking against plan. Analytics answers “why”, why a number moved, why a customer cohort behaves a certain way. Reporting is usually scheduled and standardized; analytics is usually exploratory. Both are essential, and good analytics typically depends on good reporting.
Q3. What tools are used for data reporting?
Tools range from spreadsheets and ERP-native reporting (OTBI, BI Publisher) to dedicated enterprise platforms, Tableau, Power BI, and Looker. The right choice depends on data sources, audience, and the mix of paginated, interactive, and self-service reporting required. For Oracle ERP shops, platforms with native ERP connectors and pre-built report libraries cut deployment time significantly.
Q4. How often should data reports be created?
Cadence depends on the audience and the decision. Operational reports for line managers often refresh in near real time or daily. Tactical reports run weekly. Executive reports run monthly or quarterly. Regulatory reports follow their statutory cadence. The right answer is whatever matches the decision the report enables, no faster, no slower.
Q5. What makes a good data report?
A good report has a clearly defined audience, a small set of relevant metrics, the right visualization for the message, and context, a target, a comparison period, or a benchmark, that turns the number into a decision. Reports that miss any of those usually go unused.
Q6. How do you improve data reporting?
Start by retiring the reports nobody uses. Establish a single source of truth so different reports stop disagreeing on the same number. Automate manual refreshes. Then introduce governance, owners, definitions, and an approval process for new reports, so the catalog stays clean as the business grows.
Ready to modernize data reporting in your Oracle environment? Request a demo to see how Orbit Analytics delivers operational, analytical, and regulatory reporting on the same Oracle ERP data, with pre-built reports, native Oracle Fusion Cloud reporting connectors, and self-service for business users.
