
A semantic layer is a business-facing layer of definitions that sits between stored data and the tools people use to query it. It translates physical tables and columns into terms such as customer, invoice, revenue and days sales outstanding, and it holds the logic for each metric in one place so every report, spreadsheet and AI assistant calculates it the same way.
Without one, a query has to know that net revenue lives in three joined tables, excludes intercompany lines and converts to the reporting currency. With one, the user asks for net revenue and the layer supplies the joins, filters and formula. The definition is written once and used everywhere.
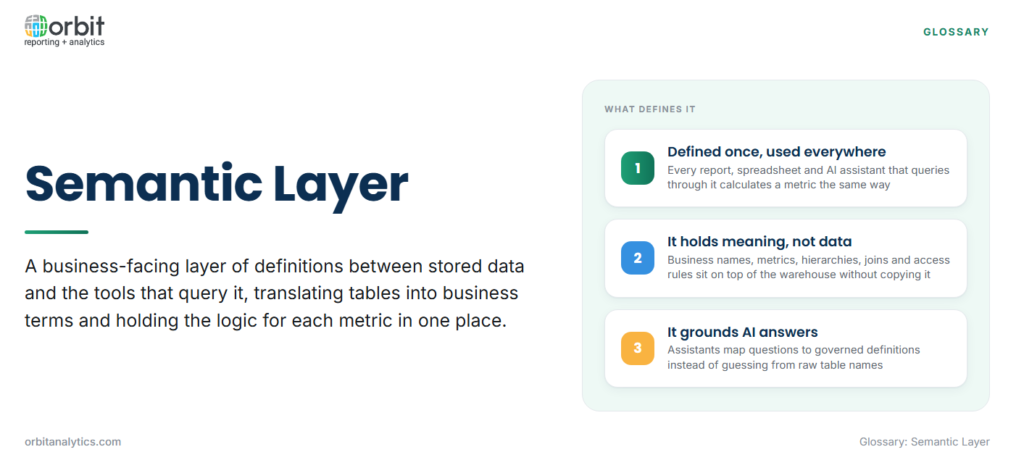
What Sits Inside a Semantic Layer
- Business entities and friendly names: tables and columns renamed into terms users recognize, such as supplier instead of a vendor site identifier.
- Metrics and their calculation logic: formulas, filters and aggregation rules for each measure, such as gross margin or open receivables.
- Dimensions and hierarchies: the ways a metric can be sliced, such as period, business unit, cost center or product, including roll-ups like month to quarter to year.
- Joins and relationships: how entities connect, so users never have to write a join or risk double counting.
- Access rules: which users can see which rows and fields, applied whichever tool runs the query.
Where the Semantic Layer Sits in the Data Stack
The semantic layer sits above storage and below every consumer.
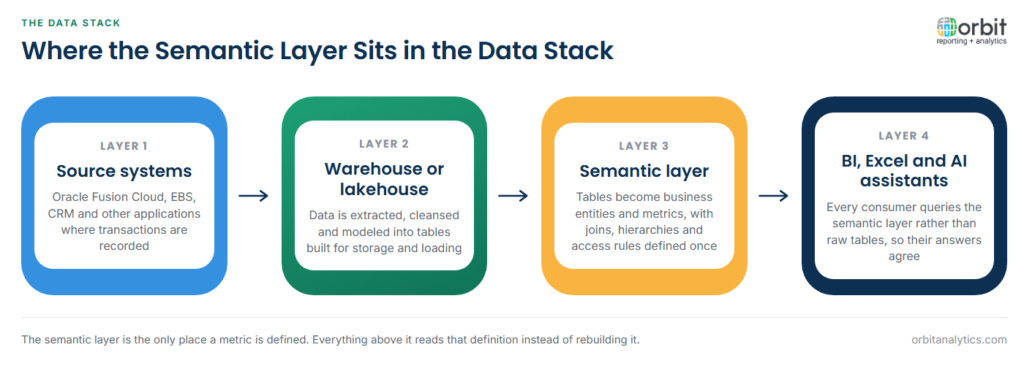
Source systems such as Oracle Fusion Cloud, EBS and CRM feed a warehouse or lakehouse, where data is cleansed and modeled. The semantic layer then reads those tables and presents them as business entities and metrics. BI dashboards, Excel, embedded reports and AI assistants all query the semantic layer rather than the raw tables, which is what keeps them in agreement.
Placing the layer here also means a new tool can be added without redefining anything. A finance team that moves from one dashboard product to another, or adds an AI assistant, points the new tool at the same definitions instead of rebuilding them.
Why Consistent Metrics Depend on It
A common symptom of a missing semantic layer is three answers to one question. Finance reports revenue from the ledger, sales reports bookings from the CRM, and an analyst’s dashboard applies a different date filter, so the same meeting sees three different numbers.
The cause is usually metric logic hidden inside individual reports. Each author rebuilt the calculation, and each made slightly different choices about returns, currency or cut-off. A semantic layer moves that logic out of the reports and into one governed definition, so a correction made once reaches every consumer. When a revenue recognition policy changes, the definition is updated in one place and every report follows, rather than someone hunting through dozens of workbooks.
This is also where much of the effort in BI goes on Oracle data. Orbit Analytics provides business intelligence that understands Oracle ERP schemas out of the box, so far less semantic modeling has to be built by hand before finance teams can report.
The Semantic Layer and AI: Grounding Answers in Governed Definitions
Large language models can write SQL, but they do not know that “revenue” at a given company excludes intercompany sales or that fiscal quarters start in April. Asked against raw tables, they guess, and a confident wrong number is worse than no answer.
A semantic layer grounds an AI answer in four steps:
- The user asks a business question, such as revenue by region last quarter.
- The assistant maps the words to defined entities and metrics in the semantic layer rather than to raw table names.
- The semantic layer generates the query, supplying the approved joins, filters and formula.
- Access rules are applied before results return, so the assistant can only show what the user is already permitted to see.
The result is an answer that matches the dashboard, because both used the same definition. Defined relationships prevent a subtler error too: an assistant querying raw tables can join them in ways that double count, such as summing invoice header totals across every invoice line.
Types of Semantic Layers
| Type | Where it lives | Strength | Limitation |
|---|---|---|---|
| BI-embedded | Inside a single BI tool’s model | Quick to build and tightly integrated with that tool | Other tools cannot reuse its definitions |
| Universal or headless | A separate service between storage and all tools | One definition serves BI, spreadsheets, apps and AI | One more component to run and govern |
| Warehouse-native | Metric definitions stored in the data platform | Close to the data and its security | Coverage depends on the platform’s features |
Many organizations run more than one. The risk is two layers defining the same metric differently, which recreates the problem the layer was meant to solve, so each metric needs a single owner.
Semantic Layers for Oracle ERP Data
Oracle ERP schemas are a strong case for a semantic layer because the physical model is close to unreadable for business users. Fusion Cloud spreads a single invoice across many tables, and EBS encodes meaning in flexfields and lookup codes.
Oracle’s own OTBI subject areas are a form of semantic layer: they group Fusion data into business-oriented folders with pre-joined attributes and measures, an approach covered under subject area modeling. They work well inside OTBI but do not extend to data held outside Fusion. Teams that move Fusion data into Snowflake or Databricks leave the subject areas behind, so the business definitions have to be rebuilt in whatever layer sits over the warehouse.
Orbit Analytics offers Fusion Analytics with pre-built data models that turn raw Fusion Cloud ERP data into governed, analytics-ready datasets with consistent KPIs, which gives teams working business definitions without modeling every table themselves.
Semantic Layer vs. Data Model vs. Data Catalog
The three are often confused because all of them describe data, but each answers a different question.
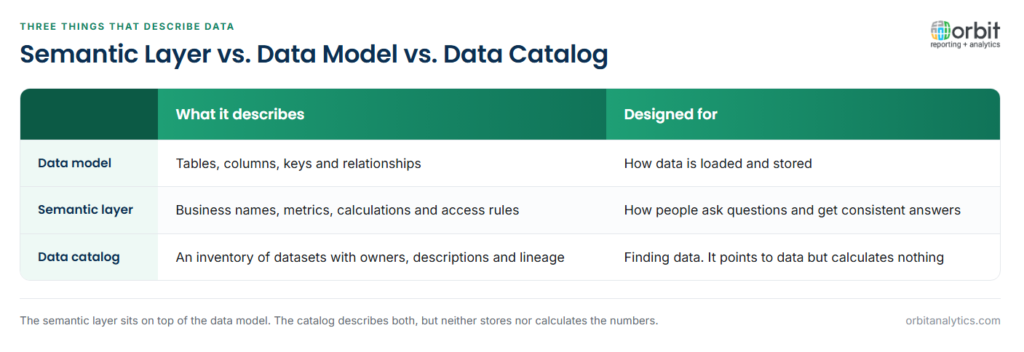
The data model describes storage: tables, columns, keys and relationships, designed for how data is loaded and held. Users rarely query it directly.
The semantic layer describes meaning and calculation: business names, metrics and rules layered on top of the data model, designed for how people ask questions.
The data catalog describes what exists: an inventory of datasets with owners, descriptions and lineage, designed for finding data. It points to data but does not calculate anything.
In practice the three work together: the catalog helps a user find the revenue metric, the semantic layer calculates it, and the data model stores the rows it reads.
Frequently Asked Questions
Q1. What is a semantic layer in simple terms?
It is a translation layer that turns database tables into business terms and defines each metric once. Every tool that queries through it gets the same answer to the same question.
Q2. What is the difference between a semantic layer and a data warehouse?
A data warehouse stores data. A semantic layer sits on top of it and describes what the data means and how metrics are calculated, without storing the data again.
Q3. Why does a semantic layer matter for AI?
AI assistants need to know what business terms mean at a specific company. A semantic layer gives them governed definitions and access rules, so answers match official reports instead of being guessed from raw tables.
Q4. What is a headless semantic layer?
It is a semantic layer that runs as a separate service rather than inside one BI tool. Any tool, application or AI assistant can query it through an API, so definitions are shared across all of them.
Q5. Is an OTBI subject area a semantic layer?
Broadly yes. OTBI subject areas present Oracle Fusion data as business folders with pre-joined attributes and measures, which is the job a semantic layer does, although only for OTBI reporting.
Consistent numbers across dashboards, spreadsheets and AI answers start with shared definitions. Orbit Analytics delivers governed business models over Oracle Fusion Cloud and EBS data. Request a demo to see them against your own metrics.
