
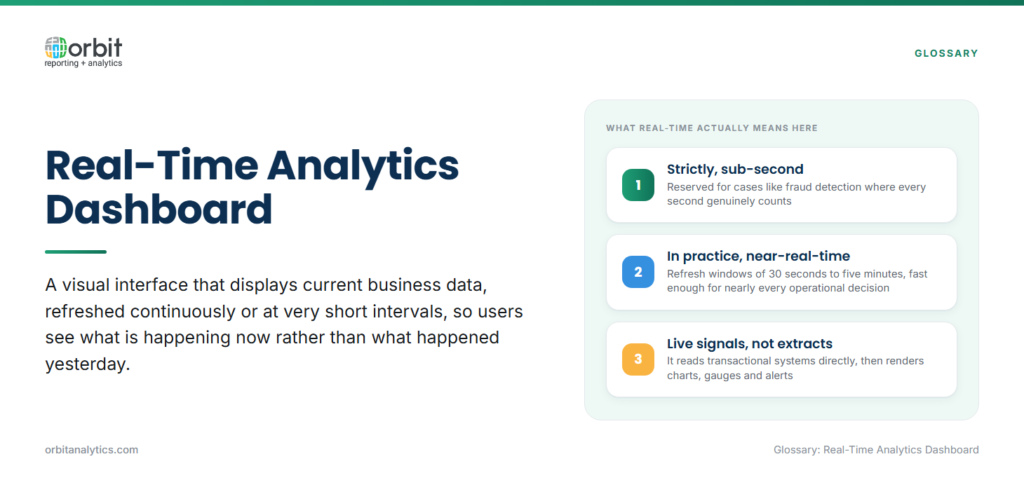
A real-time analytics dashboard is a visual interface that displays current business data, refreshed continuously or at very short intervals so users see what is happening now rather than what happened yesterday. It pulls live signals from transactional systems, applies calculations, and renders the result in charts, gauges, and alerts that update automatically.
Strictly, “real-time” means sub-second latency. In practice, most enterprise dashboards are near-real-time, refresh windows of 30 seconds to five minutes, which is fast enough for nearly every operational decision. Pure streaming is reserved for use cases like fraud detection where every second counts; batch dashboards refresh daily and suit trend analysis, not in-the-moment response.
Mechanically, a real-time dashboard depends on three layers: a pipeline that captures changes from source systems (CDC, event streams, or frequent micro-batches), a serving layer optimized for fast queries, and a front-end that re-renders without manual reload.
Why Do Organizations Need Real-Time Dashboards?
Three forces drive the move from daily reports to live dashboards:
- Opportunity cost. Every hour a decision waits for data is an hour of inventory tied up, a customer left waiting, or a problem getting bigger. Real-time visibility shrinks that decision lag from days to minutes.
- Anomaly response. Spikes in returns, regional outages, or suppliers missing a window get smoothed over by a daily report. Live data surfaces them while there is still time to act.
- Competitive pace. When peers move from end-of-week reviews to live monitoring, the slower organization is responding to last week while the faster one is responding to this hour.
Key Features of Real-Time Analytics Dashboards
A few capabilities separate a real dashboard from a glorified report.
- Live data refresh. Automatic updates at a configured interval, with clear indication of when the data was last refreshed and whether the pipeline is healthy.
- Interactive visualizations. Charts that respond to clicks, filter, drill down, cross-highlight, so users can investigate a spike without leaving the dashboard. Orbit Analytics provides interactive business intelligence dashboards with drill-through, semantic layers, and Oracle-native connectors, so the visual layer sits directly on top of Fusion Cloud or EBS data without an intermediate warehouse build.
- Alerts and notifications. Threshold-based rules that push email, SMS, or in-app alerts when a metric crosses a boundary, so users do not have to stare at the screen.
- Mobile accessibility. Phone and tablet rendering for leaders who need a quick check from a meeting or the floor.
- Drill-down capabilities. From a roll-up KPI to the underlying transactions, without exporting to a separate tool.
Benefits of Real-Time Analytics Dashboards
The payoff shows up in four areas:
- Decisions in the moment. When the data is live, leaders intervene during a shift instead of debriefing about it the next morning.
- Anomalies caught early. A change in conversion rate, a spike in defects, an unusual drop in cash position, all surface in time to investigate rather than appearing as a footnote in next week’s deck.
- Operational efficiency. The team stops chasing exports because the canonical view is always one click away.
- Stronger customer experience. Issues are detected and resolved before customers escalate them.
Real-Time Dashboard Use Cases by Function
The pattern repeats across functions, with the metrics changing but the underlying mechanism (live data, focused metrics, drill-down, alerts) staying the same:
| Function | Typical Live Metrics | Common Refresh Cadence |
| Finance | Cash position, AR aging, payment status, transaction monitoring during close | Hourly to 5-minute |
| Operations | Supply chain visibility, inventory levels, production output, on-time delivery | 1 to 5 minutes |
| Sales | Pipeline movement, daily booking trends, rep activity by region | 15 minutes to hourly |
| IT | System performance, API latency, security event monitoring | Sub-minute |
Each function gets a different view, but the platform underneath does the same job: capture changes, serve fast queries, render live.
Challenges with Real-Time Dashboards
Three issues recur when teams build their first one:
- Data integration complexity. Pulling live data from multiple Oracle modules plus the side systems most enterprises run alongside takes careful pipeline design with CDC or event streaming.
- System performance impact. Querying production ERP every minute can degrade the source. The fix is to capture changes into a serving layer optimized for analytical queries, rather than reading directly from the transactional database.
- Information overload. A dashboard with 40 tiles is worse than no dashboard. Discipline on which metrics matter, and which thresholds warrant attention, is the single most important design choice.
Best Practices for Real-Time Dashboard Design
Focus on actionable metrics, numbers tied to a decision someone in front of the dashboard will actually make. If a metric is interesting but does not change anyone’s behavior, it belongs in a deeper report, not on the dashboard.
Design for the audience. An ops floor monitor is read from 15 feet away and needs four big numbers; an analyst dashboard can carry more density. Keep scope narrow, one dashboard, one decision domain, and resist the urge to make a master view of everything. Set alert thresholds at levels that mean something; alerts that fire every hour get muted within a week.
How to Build a Real-Time Analytics Dashboard
The build follows five steps:
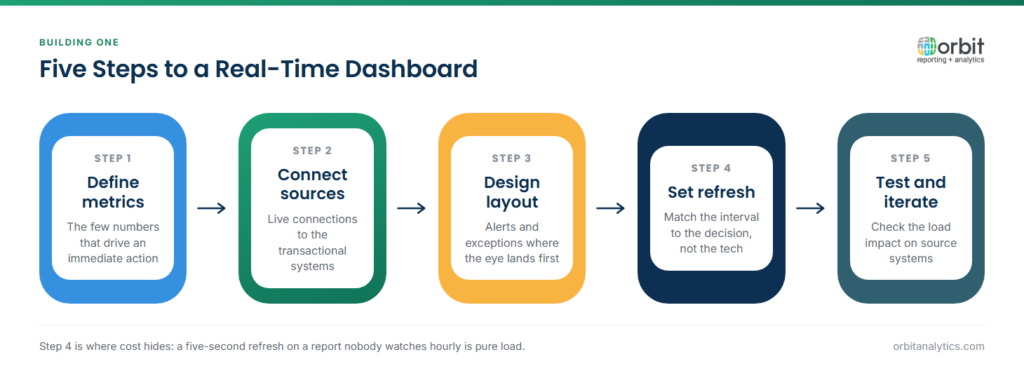
- Define key metrics and KPIs. Start from the decision, not the data. What will someone do differently if they see this number changing?
- Connect data sources. Identify which Oracle modules and side systems hold the source data and how live they need to be. Pre-built connectors collapse weeks of integration work.
- Design the dashboard layout. Group related metrics, use the top-left for the most important number, and reserve space for context (target, trend, comparison period).
- Configure refresh intervals. Match the refresh rate to the decision cadence: five minutes for ops, thirty seconds for fraud, hourly for financial monitoring.
- Test and iterate. Watch how people actually use it. Retire what they ignore.
Orbit Analytics supports this build with pre-built Oracle ERP connectors, real-time refresh on Fusion Cloud and EBS data, and self-service reporting so business users can extend dashboards without IT tickets. That dramatically shortens the cycle from “we need this view” to “it’s live.”
Frequently Asked Questions
Q1. What is a real-time analytics dashboard?
A real-time analytics dashboard is a visual interface that displays current business data refreshed continuously or in short intervals, so users see what is happening now and can act on it immediately rather than waiting for periodic reports.
Q2. What is the difference between real-time and batch analytics?
Real-time analytics refresh within seconds or minutes of the underlying event and support in-the-moment decisions. Batch analytics refresh on a fixed schedule, typically daily or weekly, and are better suited to trend analysis and reporting.
Q3. How often do real-time dashboards refresh?
True streaming dashboards refresh sub-second. Most enterprise dashboards are near-real-time, refreshing every 30 seconds to five minutes, which is fast enough for nearly every operational decision while staying easy to support.
Q4. Can real-time dashboards connect to Oracle ERP?
Yes. Oracle Fusion Cloud, EBS, NetSuite, and PeopleSoft all expose live data through their respective interfaces, and platforms with pre-built Oracle connectors can deliver real-time dashboards without custom integration work.
Q5. Do real-time dashboards impact system performance?
They can if they query the transactional database directly. The standard pattern is to capture changes into an analytical serving layer and read dashboards from there, which protects the source system while still delivering near-real-time visibility.
Q6. Can I access real-time dashboards on mobile?
Most modern dashboards support responsive rendering for phones and tablets, with key tiles optimized for small screens. This matters for leaders who need quick checks from a meeting, the floor, or the road.
A real-time analytics dashboard is one of the highest-impact investments a data-driven enterprise can make. Orbit Analytics delivers live Oracle ERP dashboards with pre-built connectors, interactive visualizations, and built-in alerting, so teams can move from reactive reviews to in-the-moment decisions. Request a demo to see it on your data.
