
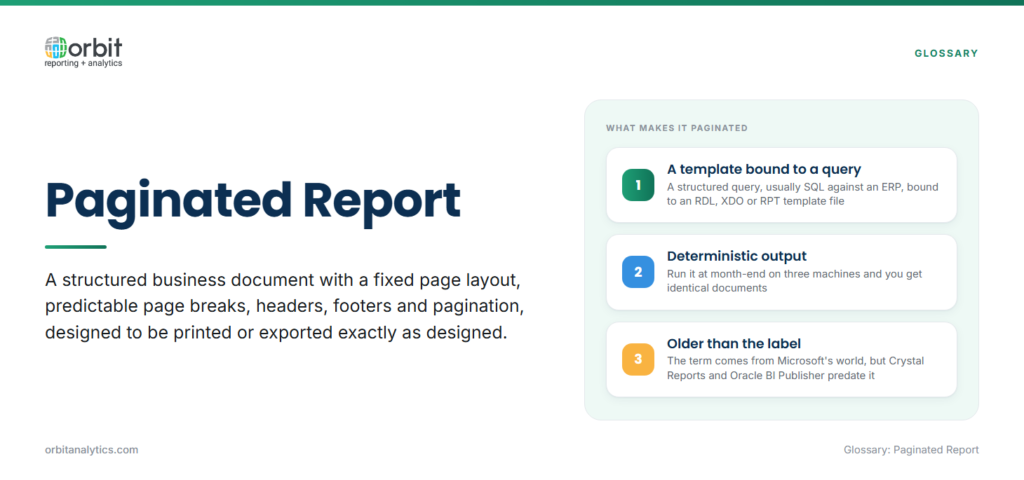
A paginated report is a structured business document with a fixed page layout, predictable page breaks, headers, footers, and pagination, designed to be printed or exported as-is. The term comes from Microsoft’s reporting world (SSRS, Power BI Paginated Reports), but the format predates it: Crystal Reports, Oracle BI Publisher, and Jasper all built on the same idea. The defining trait is that the author controls exactly where every element appears on every page.
Paginated reports work by binding a structured query, typically SQL against an ERP source, to a template file (RDL, XDO, RPT). When the report runs, the engine paginates the result set, applies grouping and subtotals, repeats headers, and produces deterministic output. Run the same report at month-end across three machines and you get identical files.
That is the opposite of how interactive reports behave. A dashboard adapts to the screen, lets users filter and drill, and is rarely meant to be printed. A paginated report is meant to be read end-to-end, archived, and sometimes mailed. Both have a place; they solve different problems.
Why Are Paginated Reports Important?
Three reasons keep paginated reporting at the center of enterprise stacks:
- Print-ready output: Audit packs, board books, customer invoices, and tax filings need consistent margins, page numbers, and a known page count. Interactive tools struggle because their layouts reflow based on screen size.
- Large data sets: A paginated report can stream tens of thousands of rows into a structured document (a full GL detail extract, every open AR invoice, a fixed-asset register) without the rendering problems dashboards hit at scale.
- Compliance: Regulators and auditors expect documentation in a format that can be archived, signed, and reproduced years later. Pixel-perfect paginated output checks that box; an interactive Power BI report usually does not.
What Are the Key Features of Paginated Reports?
Paginated reports share a recognizable feature set across tools, what changes is the engine underneath.
- Fixed page layout and breaks: the author defines page size, margins, orientation, and group-level breaks (e.g., new page per legal entity).
- Headers, footers, and page numbers: repeating headers, footers with file names and timestamps, and “Page X of Y” pagination are built in.
- Grouping and subtotals: multi-level grouping with running totals, subtotals, and grand totals is native, which is what makes financial statements practical.
- Multiple export formats: the same template renders to PDF, Excel, Word, and CSV from a single source.
For Oracle ERP teams, Orbit Analytics provides flexible paginated report templates that connect directly to Fusion Cloud and EBS schemas, along with enterprise paginated reporting for high-volume operational documents. Templates can be parameterized by ledger, period, or business unit, so one template covers a global rollout instead of one per entity.
When Should You Use Paginated Reports?
Paginated reports shine in four scenarios:
- Financial statements and period-close packs: P&L, balance sheet, and trial balance need a fixed structure and exact subtotals at every level.
- Operational documents: Invoices, purchase orders, and packing slips have to look the same every time and often carry legal weight.
- Compliance and audit documentation: SOX walkthroughs, tax filings, and regulatory submissions need to be archivable and reproducible.
- Multi-page data exports: A full GL detail listing or an open-PO register pushes thousands of rows into a paginated document that finance teams actually use.
If the consumer is going to print, sign, or archive it, you want a paginated report. If they’re going to filter, drill, and explore, you want an interactive one.
Paginated Reports vs. Power BI Reports: Which to Choose?
Match the report type to how the output will be consumed.
| Dimension | Paginated reports | Interactive (Power BI-style) |
| Primary use | Documents to read end-to-end | Exploration and analysis |
| User behavior | Open, read, archive, share | Slice, drill, ask follow-ups |
| Data volume | Tens to hundreds of thousands of rows | Summarize first, then drill |
| Layout | Fixed pages, exact pagination | Adapts to screen size |
| Best for | 60-page board pack as single PDF | Revenue analysis across years and segments |
The output format requirement settles most edge cases. Need a 60-page board pack as a single PDF with exact pagination? Paginated. Need an exploratory revenue analysis across three years and twelve segments? Interactive. Many enterprise platforms give you both inside one product, so the choice happens at the report level, not the platform level.
What Challenges Come with Paginated Reports?
Paginated reports come with three recurring headaches: layout complexity (getting subtotals, group breaks, and conditional formatting right takes design work), performance with very large queries, and template maintenance over time as charts of accounts change and regulators update formats. The fix for all three is structural: a governed template library with versioning, parameterized templates instead of duplicates, pushed-down query logic into the database, and pre-aggregation in the data layer for the heaviest documents. Tools that sit directly on the Oracle data model, rather than a separate semantic layer, cut a lot of the maintenance overhead.
What Are Paginated Report Best Practices?
Plan the layout before you build, sketch the page, define groupings, decide which subtotals go where, and confirm export formats with the consumer. Optimize queries early; the SQL behind a paginated report should be tuned the same way you’d tune any production query, with appropriate indexes and predicate pushdown. Use parameters generously so one template can serve many ledgers, business units, or periods. And test across every output format the report will be delivered in, PDF, Excel, Word, because each engine handles formatting slightly differently.
How Do You Create Paginated Reports?
Creating a production-grade paginated report comes down to four steps:
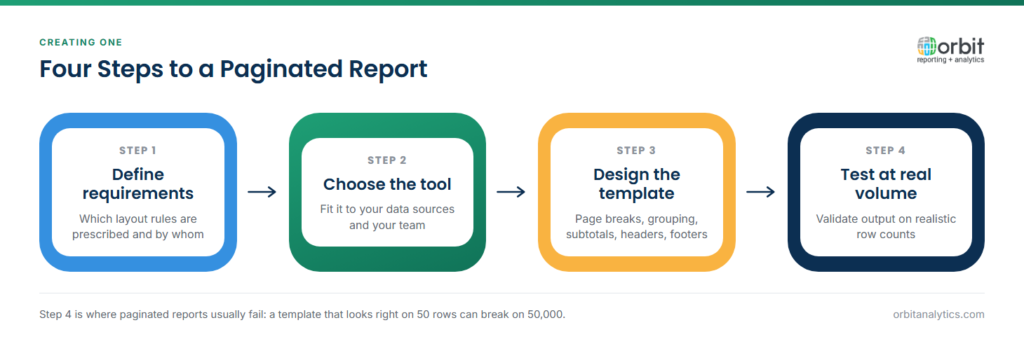
- Define the requirements. Document who consumes the report, how often, in what format, what columns and subtotals are needed, and what compliance constraints apply.
- Choose a tool that fits your data and your team. Orbit Analytics positions as a full-stack enterprise operational reporting platform for Oracle ERP shops, with native connectors to Fusion Cloud, EBS, NetSuite, and PeopleSoft, 1,000+ pre-built reports, and an Excel-friendly design surface that finance teams adopt quickly.
- Design the template using grouping, parameters, and a layout that matches the consumer’s expectations.
- Connect the data, run it across realistic volumes, and validate the output in every format before going live.
Frequently Asked Questions
Q1. What is a paginated report in simple terms?
A paginated report is a business document with a fixed page layout and predictable page breaks, designed to be printed or exported as a multi-page PDF, Excel, or Word file. Each page looks the same every time the report runs, which makes it the standard format for invoices, financial statements, and audit documentation.
Q2. What is the difference between paginated and interactive reports?
Paginated reports have a fixed layout designed for printing or archiving, with controlled page breaks and headers that repeat on every page. Interactive reports adapt to the screen, support filtering and drill-down, and are built for exploration. Choose paginated when the output is a document, interactive when the output is an analysis.
Q3. Can paginated reports handle millions of rows?
Yes, paginated reports are designed to stream large result sets into structured documents and routinely handle hundreds of thousands of rows. For multi-million-row extracts, the practical limits are query performance and rendering time, both addressed with database tuning, pre-aggregation, and partitioned queries.
Q4. Can paginated reports connect to Oracle ERP?
Yes. Paginated reports are heavily used against Oracle EBS, Fusion Cloud, and PeopleSoft because finance and operations teams need pixel-perfect documents from those systems. Native Oracle ERP connectors remove the need to stage data in a separate warehouse first.
Q5. Are paginated reports still relevant with modern BI?
Very much so. Dashboards are now the default for exploration, but paginated reports remain the default for everything that needs to be printed, archived, or audited. Most enterprise platforms now ship both formats so teams don’t have to choose between document-grade output and interactive analysis.
Ready to put paginated reporting to work in your Oracle environment? Request a demo to see how Orbit Analytics delivers pixel-perfect documents and interactive analytics from the same Oracle Fusion Cloud or EBS data, without a separate warehouse and without giving up self-service reporting for business users.
