
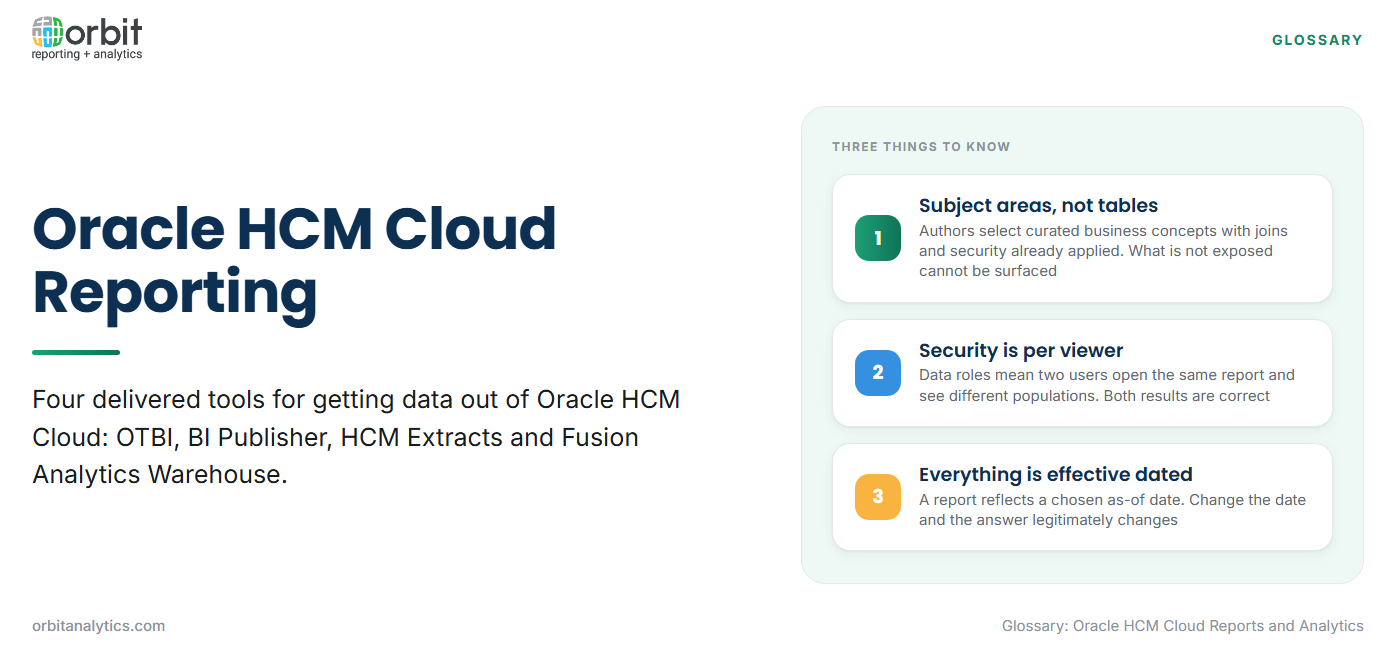
Teams working in Oracle HCM Cloud using reports and analytics have four delivered tools available, and most of the frustration in HCM reporting comes from reaching for the wrong one. OTBI, BI Publisher, HCM Extracts and Fusion Analytics Warehouse each solve a genuinely different problem, and none of them substitutes for another.
What ships in the box is more capable than it first appears. Oracle delivers hundreds of prebuilt analyses and dozens of subject areas covering worker, assignment, absence, payroll and recruitment data, and a good proportion of routine requests are answered by an existing report nobody has looked for.
The reporting model works against subject areas rather than tables. A subject area is a curated set of related attributes and measures with the joins already made and security already applied, so a report author selects business concepts instead of writing SQL. This is what makes HCM reporting accessible and what limits it: if the subject area does not expose an attribute, no amount of skill will surface it.
Who builds and who consumes are usually different populations. HR analysts and system administrators build; line managers, HR business partners and finance consume. Getting that split right matters more than tool choice, because a report nobody can find is functionally the same as a report that does not exist.
The four reporting tools and what each is for
- OTBI handles ad hoc analysis and interactive dashboards against subject areas. Reach for it when someone needs to explore, filter and slice.
- BI Publisher produces formatted, pixel-controlled output. Reach for it when the result gets printed, signed or sent outside the organization.
- HCM Extracts moves bulk data outbound on a schedule, typically to a payroll provider, a benefits administrator or a warehouse. Reach for it when the consumer is a system rather than a person.
- Fusion Analytics Warehouse provides cross-pillar analysis with history, joining HCM to finance and other pillars. Reach for it when the question spans more than HCM.
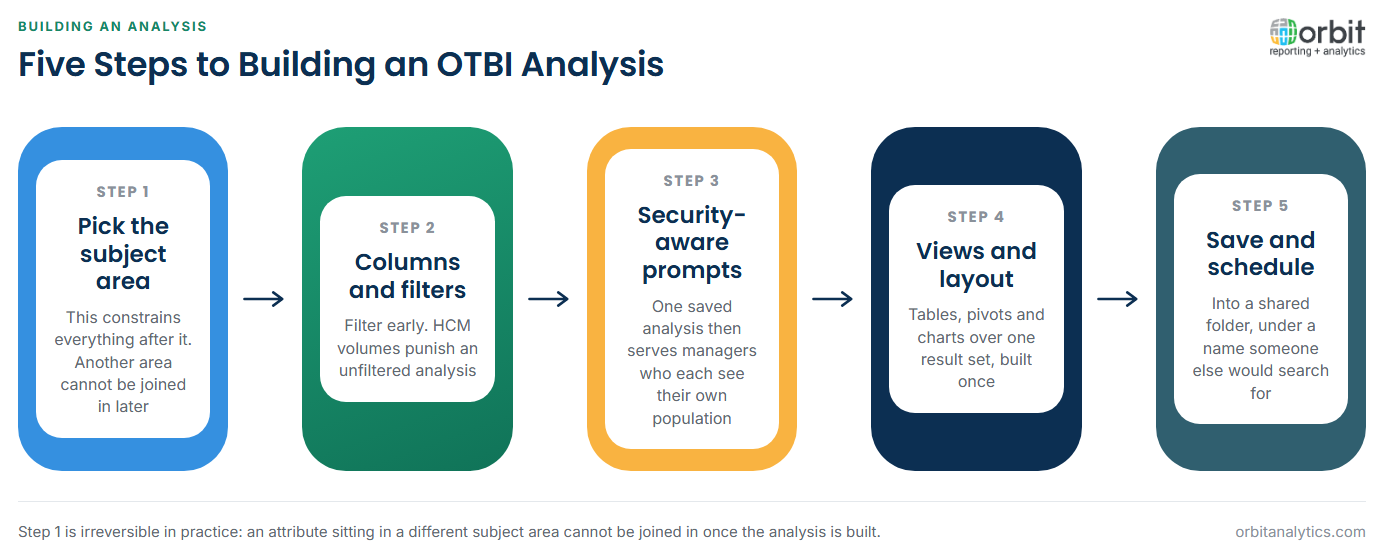
How to build an OTBI analysis
- Pick the subject area. This is the decision that constrains everything after it; an attribute in a different subject area cannot be joined in later.
- Select columns and set filters. Add the attributes and measures, then filter early. HCM data volumes punish unfiltered analyses.
- Apply security-aware prompts. Prompts should respect the viewer’s data access, so one saved analysis serves managers who each see only their own population.
- Add views and a layout. Tables, pivots and charts are views over the same result set; build the layout once rather than duplicating the analysis.
- Save, share and schedule. Save to a shared folder with a name someone else would search for, then schedule delivery if it recurs.
How to build an HCM Extract
- Define the extract and its delivery. Name it, set the delivery method and the output format the consuming system expects.
- Build the data groups and records. Data groups map to entities such as worker or assignment; records and attributes define what each contributes.
- Add fast formulas where logic is needed. Derived values, conditional inclusion and formatting rules live in fast formulas rather than in the consuming system.
- Set the extract criteria and change-only rules. Decide whether each run sends everything or only what changed. Change-only is usually correct and is where most extract bugs originate.
- Validate and schedule the run. Compare a full run against a change-only run before trusting the incremental logic.
Security in HCM reporting
Data roles and security profiles determine which workers a user can see. A manager sees their own hierarchy, an HR business partner sees their assigned business unit, a payroll administrator sees a payroll-defined population.
This produces a support pattern worth anticipating: two users open the same report and get different numbers, and both are correct. It is the security model working, not a defect, but it needs explaining every time it comes up. The practical consequence is that totals in HCM reports are audience-relative, so a headcount figure should always carry the population it was run against.
Personal and payroll data raise the stakes. Salary, bank details, health-related absence and performance data are all reachable through reporting subject areas, and a reporting layer that bypasses application security has created a data protection problem rather than a reporting convenience.
Combining HCM data with finance and operations
The most common request HCM tooling handles worst is headcount against cost. Headcount lives in HCM, cost lives in the general ledger, and the delivered subject areas do not span the two.
Joining them means agreeing keys. Worker, position and cost centre are the usual candidates, and each has complications: a worker can hold multiple assignments across cost centres, a position can be vacant, and cost centre structures change more often in finance than in HR.
Orbit Analytics reads HCM alongside financial and operational data from Oracle Fusion Cloud and E-Business Suite through its Fusion Cloud reporting, so cost per head, cost per position and workforce cost by department resolve in a single report rather than through a spreadsheet join. Giving managers direct access to that view is the practical form of self-service reporting in an HR context.
Common HCM reporting problems
Effective dating and as-of reporting is the concept that breaks naive HCM reports. Almost every HCM record is effective dated, so a report must state the date it reflects. Running the same headcount report twice with different as-of dates legitimately returns different answers.
Assignment changes that split a worker’s history cause a promotion or transfer to appear as two rows, which inflates counts unless the report deduplicates to a single assignment per worker per period.
Extracts that silently return fewer rows are the most dangerous, because nothing errors. A change-only extract with a misconfigured criterion sends a partial file, the downstream system processes it, and nobody notices until a payroll cycle goes wrong. Row-count reconciliation against the source is the check that catches it, and Orbit Analytics applies exactly that as data is pulled.
OTBI, BI Publisher and HCM Extracts compared
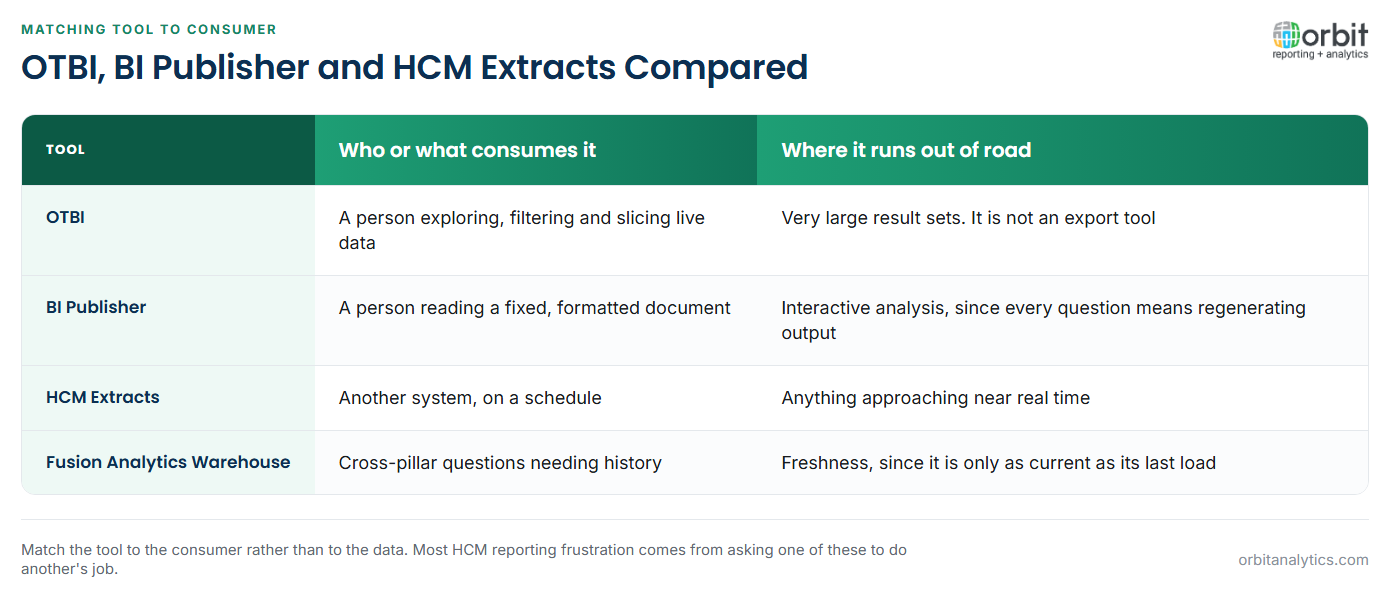
Each tool also has a point where it runs out of road, and knowing that is more useful than a feature list.
What each produces. OTBI produces interactive analyses; it struggles with very large result sets and is not the tool for a fifty-thousand-row export. BI Publisher produces formatted documents; it is poor at interactive analysis, so using it for exploration means regenerating output for every question. HCM Extracts produce files; they run on a schedule and cannot serve a near real-time need.
How fresh the data is. OTBI and BI Publisher query live transactional data. Extracts are as fresh as their last scheduled run. Fusion Analytics Warehouse is as fresh as its last load, in exchange for history and cross-pillar reach.
Who can build it. OTBI is accessible to a trained analyst. BI Publisher needs template skills. Extracts need fast formula knowledge and are usually owned by a specialist.
Match the tool to the consumer: a person exploring gets OTBI, a person reading a fixed document gets BI Publisher, a system gets an extract, and a cross-pillar question gets the warehouse.
Frequently Asked Questions
Q1. What reporting tools are available in Oracle HCM Cloud?
Four: OTBI for ad hoc analysis, BI Publisher for formatted output, HCM Extracts for scheduled bulk outbound data, and Fusion Analytics Warehouse for cross-pillar analysis with history.
Q2. What is OTBI in Oracle HCM Cloud?
Oracle Transactional Business Intelligence, the delivered tool for building interactive analyses against curated subject areas covering live HCM data, with application security applied.
Q3. What is an HCM Extract?
A configurable outbound data process that sends bulk HCM data on a schedule to another system, built from data groups, records and fast formulas.
Q4. Why do two users see different results from the same HCM report?
Because data roles and security profiles limit which workers each user can see. Both results are correct for their respective populations, which is why a headcount figure should state the population it covers.
Q5. What is effective dating in HCM reporting?
Almost every HCM record carries effective start and end dates, so a report reflects the state as at a chosen date. Changing the as-of date legitimately changes the answer.
Q6. How do you combine HCM data with financial data?
By joining on worker, position or cost centre outside the delivered subject areas, which do not span pillars. The complications are multiple assignments, vacant positions and cost centre structures that change at different rates.
Headcount against cost is the question HCM tooling answers worst, and it is the one finance asks most. Orbit Analytics reports HCM alongside ledger data from Fusion Cloud and EBS in one place. Request a demo to see it on your own workforce data.
