
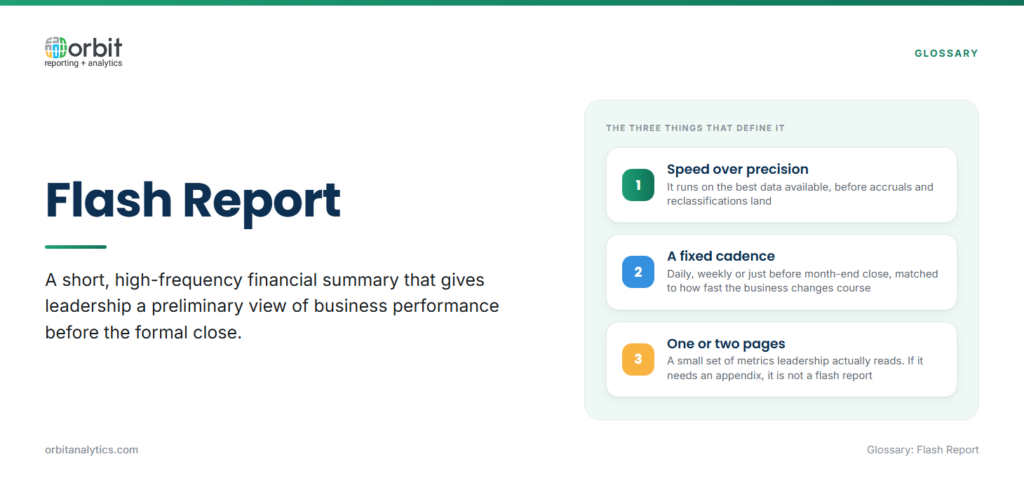
A flash report is a short, high-frequency financial summary that gives leadership a preliminary view of business performance before the formal close. It fits on one or two pages, focuses on a small set of metrics that matter most to the business, and is produced on a fixed cadence, daily, weekly, or just before month-end close.
The defining feature is speed over precision. A flash report uses the best data available at the moment it runs, which means some adjustments, accruals, and reclassifications won’t yet be in. That’s by design. The point isn’t to replace statutory financials, it’s to give decision-makers a directional read while there’s still time to act.
Flash reports matter in fast-moving businesses because the cost of waiting three weeks for a clean close is larger than the cost of a small reporting variance. A retailer noticing a same-store sales drop on Monday can change pricing by Wednesday; noticing it at month-end means the month is already lost.
Why Do Organizations Need Flash Reports?
Three drivers push finance teams to introduce flash reporting:
- Early visibility: Leadership sees revenue, cash, and key expenses while the period is in flight, not weeks after.
- Faster decision-making between close cycles: Promotions, hiring freezes, vendor renegotiations, and inventory adjustments happen on shorter cycles than monthly close allows.
- Proactive issue identification: Variance from forecast, a cash crunch, or margin compression shows up days or weeks before it would surface in formal financials.
For Oracle ERP shops, flash reports pull live Fusion Cloud, EBS, or NetSuite data into a format the CFO actually reads.
Key Components of a Flash Report
A good flash report is short and disciplined. Five blocks cover what leadership actually reads:
- Revenue and sales highlights: Period-to-date revenue, segment splits, comparison to budget and prior period.
- Cash position and collections: Opening cash, current balance, DSO trend, and any covenant headroom that matters.
- Key expense categories: Payroll, vendor spend, and large discretionary lines, with comparison to forecast.
- Operational metrics: Production output, store traffic, billable utilization, sitting alongside the financial lines.
- Variance from budget or forecast: A clear callout of where the period is tracking.
If a flash report needs an appendix, it isn’t a flash report anymore.
Flash Report Timing and Frequency
Cadence should match how often the business actually changes course:
| Cadence | Best For | Typical Content |
| Daily | Retail, e-commerce, manufacturing | Daily sales, production output, inventory positions on the leadership team’s desk before 9am |
| Weekly | B2B services, professional services, most software | Week-over-week pipeline, bookings, cash, utilization |
| Monthly pre-close | Organizations closing once a month | Preliminary P&L and balance sheet on day -3 or -5 of close, before official numbers are finalized |
Daily reports for a business that meets monthly create noise; weekly reports for a daily-cadence business create blind spots.
How to Create an Effective Flash Report
Building a flash report that survives more than two cycles comes down to five steps:
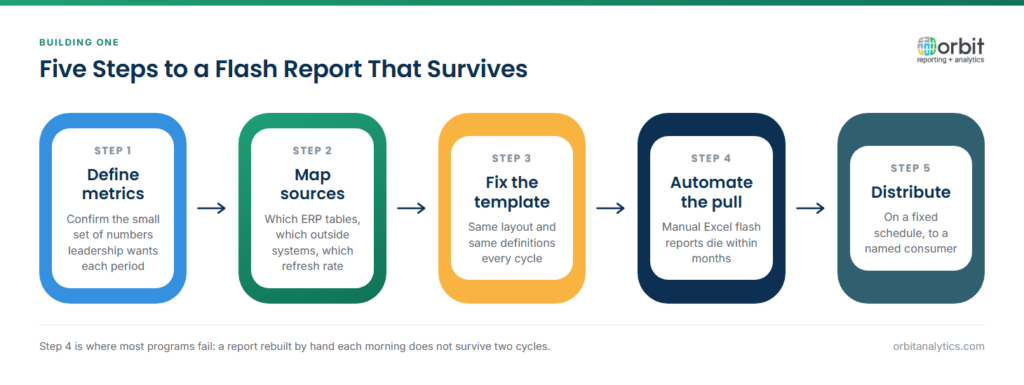
- Define the metrics. Talk to the CFO or business unit head and confirm the small set of numbers they want every period.
- Establish data sources. Identify which Oracle ERP tables hold the source data, where non-ERP data lives (CRM, POS, payroll), and what refresh cadence each source supports.
- Build a consistent template. Same layout, same metric definitions, same comparison periods every cycle.
- Automate the data collection. Manual flash reports built in Excel die within months. Orbit Analytics provides operational reporting tools with real-time Oracle Fusion Cloud, EBS, and NetSuite data access, so a flash report refreshes overnight (or hourly) directly from live ERP data instead of relying on someone exporting CSVs at 7am.
- Distribute. Put the report in front of the consumer on a fixed schedule via email, Slack, or an executive dashboard.
Common Challenges with Flash Reporting
Three challenges derail most flash reporting programs, and all share a root cause: manual work.
- Data accuracy before close: Accruals, intercompany eliminations, and late invoices won’t yet be in. The fix is to set expectations explicitly.
- Manual data collection delays: The most common killer. A flash report that requires exporting six reports, pasting them into a template, and reconciling them by 8am isn’t sustainable.
- Balancing speed and precision: A judgment call. Most teams find 90% accuracy three weeks earlier is more valuable than 100% accuracy at close.
Flash Report Examples by Industry
The metrics differ, but the discipline is the same: small set of numbers, fixed cadence, automated extraction, consistent template.
| Industry | Flash Report Focus | Typical Metrics |
| Retail | Daily sales and inventory | Same-store sales, units sold, in-stock percentage, gross margin per category |
| Manufacturing | Production and cost | Output by line, scrap rate, raw material consumption, labor variance |
| Services | Utilization and revenue | Billable hours, utilization rate, pipeline coverage, realized rate |
| Multi-entity | Consolidated performance | Entity-level P&L, FX exposure, cash by entity |
Best Practices for Flash Reporting
Four habits keep a flash report useful past the first cycle:
- Keep it simple and focused. A flash report that grows past two pages stops being a flash report.
- Automate data extraction from ERP systems so the report refreshes without analyst time. Pulling real-time Oracle data through native connectors removes most of the manual reconciliation overhead.
- Include trend comparisons: current versus prior period, versus budget, versus same period last year, because a number without context is hard to act on.
- Highlight exceptions and variances explicitly. Orbit Analytics supports this pattern with automated alerts on variance thresholds.
Flash Report vs. Other Financial Reports
Each format earns its place by doing a different job:
| Report Type | Format | Frequency | Purpose |
| Flash report | Directional preview, 1-2 pages | Daily, weekly, or pre-close | Internal decision-making before close |
| Income statement | Full, audited summary | At close | Statutory and historical reporting |
| Management report | Deeper P&L with variance commentary | Often monthly | Detailed business review |
| KPI dashboard | Interactive, exploratory | Continuous | Ad hoc analysis and drill-down |
Use each for the job it’s designed for.
Frequently Asked Questions
Q1. What is a flash report in finance?
A flash report is a short, high-frequency financial summary that gives leadership a preliminary view of business performance before the formal close. It typically covers revenue, cash, key expenses, and operational drivers, and is produced daily, weekly, or pre-close depending on the business.
Q2. What is the difference between a flash report and a financial statement?
A financial statement is the full, audited summary produced at the end of a closed period, it’s exact, comprehensive, and statutory. A flash report is a directional preview produced before close, focused on a small set of metrics, and is meant for internal decision-making rather than external reporting.
Q3. How often should flash reports be produced?
Cadence depends on how fast the business changes. Daily flash reports suit retail, manufacturing, and e-commerce; weekly reports suit professional services and most B2B businesses; pre-close monthly flash reports suit organizations that close once a month. Match the frequency to the decision cycle, not to convenience.
Q4. Who uses flash reports?
The primary consumers are CFOs, business unit heads, and executive teams who need an early read on performance. Operations leaders also use flash reports for daily decisions on inventory, pricing, and staffing. In smaller organizations, the CEO is often the main consumer.
Q5. Can flash reports be automated?
Yes, and they should be. A manual flash report in Excel is the leading cause of flash reporting programs dying within a year. Automating data extraction from Oracle ERP, consolidation across sources, and distribution to consumers is what makes flash reporting sustainable past the first few cycles.
Q6. What is the difference between a flash report and a dashboard?
A flash report is a fixed document with a defined layout, designed to be read top to bottom on a regular cadence. A dashboard is an interactive interface for exploration. Many finance teams use both: a flash report for the periodic snapshot and a dashboard for ad-hoc analysis.
Ready to automate flash reporting on your Oracle ERP data? Request a demo to see how Orbit Analytics pulls real-time Fusion Cloud, EBS, and NetSuite data into automated flash reports, with native GL Sense financial reporting and pre-built KPIs that get your CFO an early read without an analyst rebuilding the report each morning.
