
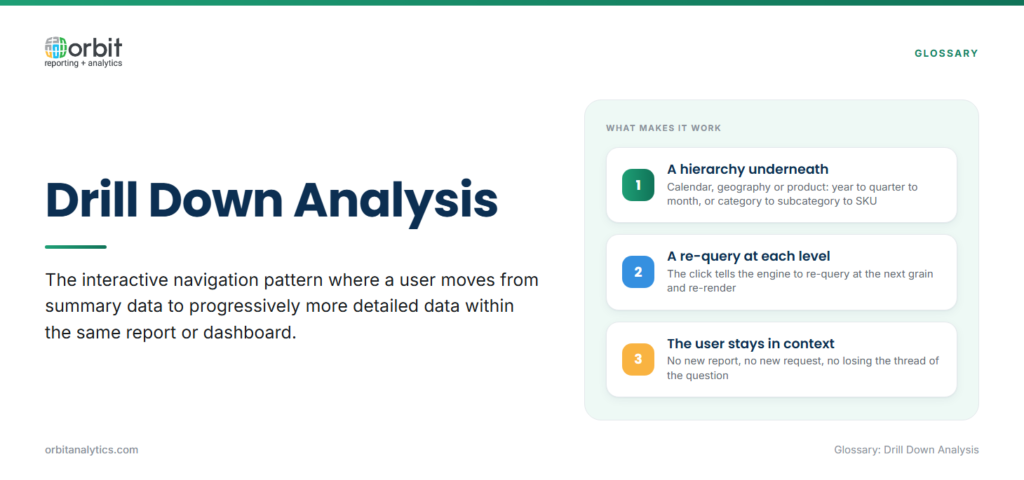
Drill down analysis is the interactive navigation pattern where a user moves from summary data to progressively more detailed data within the same report or dashboard. The user clicks a total, and the BI tool reveals the components that add up to it. Click again, and the next level of detail appears. The session keeps the user in context, same filters, same time window, but exposes a finer grain at each step.
Under the hood, the BI tool relies on a hierarchy: calendar (year-quarter-month-day), geography (region-country-city), or product (category-subcategory-SKU). The drill-down action tells the engine to re-query at the next level and re-render the visualization with the new grain.
Drill down is one of three related navigation patterns:
- Drill down: Moves to a lower level within the same hierarchy.
- Drill through: Opens a different report with the selected context, like clicking a journal balance to open the underlying journal lines.
- Drill across: Moves laterally to a related fact table, from revenue to the matching cost or quantity.
Most enterprise BI tools support all three.
Why is Drill Down Analysis Important?
Summary numbers raise questions; detail numbers answer them. Without drill down, a manager who spots an anomaly has to either accept the summary or wait for an analyst to pull the detail manually. With drill down, the manager answers the question themselves in seconds.
Four practical effects follow:
- Faster root-cause identification: A finance manager who sees a budget variance can drill to the responsible cost center and account in the same session.
- Fewer ad-hoc requests: IT and BI teams field less manual pull work because business users self-serve.
- Better data literacy: Users learn the structure of their own data by navigating it.
- Stronger strategic decisions: They’re based on evidence the decision-maker actually inspected.
For Oracle ERP teams, drill down is the bridge between high-level business intelligence dashboards and the transactional detail in Fusion, EBS, and the financial subledgers.
What Are the Key Components of Drill Down?
Four components determine whether a drill down implementation is reliable at scale.
- Hierarchies and dimensions. The pre-defined paths users navigate, calendar, geography, organization, product, GL account, customer. They have to match how the business thinks, not just how the source system structures data.
- Parent-child relationships. Which detail rows belong to which summary. In financial reporting, this is the GL chart of accounts; in sales, the territory and rep structure. Clean mapping is the single most common bottleneck.
- Aggregation levels. The grain at which each level is summarized. Drill down moves the query from one grain to the next, faster than asking the user to filter and re-aggregate manually.
- Interactive navigation. Expandable rows, click-to-drill, and breadcrumbs that let a user move up and down the hierarchy without losing context.
Orbit Analytics provides interactive drill down capabilities with pre-built Oracle hierarchies, GL account, organizational, calendar, and customer/supplier, so teams can drill from summary to detail against live Fusion and EBS data without building those hierarchies from scratch.
What Are Common Drill Down Analysis Use Cases?
Four patterns recur across Oracle ERP customers:
| Function | Drill path |
| Financial reporting | GL trial balance to cost center to natural account to journal line to source AP invoice or AR transaction, often through tools like GL Sense |
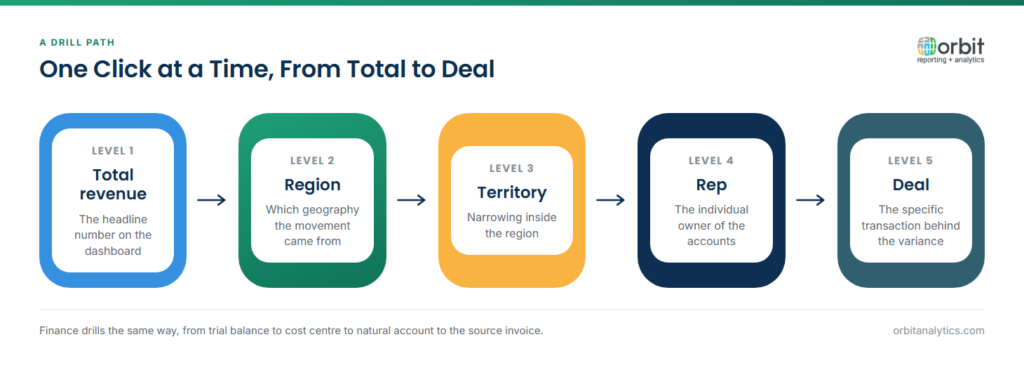
| Sales analysis | Total revenue to region to territory to rep to deal |
| Inventory | Category to subcategory to SKU |
| HR | Headcount or compensation totals to department to team to individual |
The common thread: the user starts with a number that raises a question and ends with the underlying transactions that answer it, without leaving the dashboard or filing a ticket. Orbit Analytics ships pre-built GL-to-subledger drill paths for Oracle Fusion Cloud and EBS, so a controller can navigate from a consolidated trial balance to the source AP or AR transaction in the same session, against live ERP data with no separate warehouse.
What Are the Benefits of Drill Down Analysis?
Four benefits show up consistently:
- Faster problem identification: Users investigate anomalies in the same session they spotted them.
- Less dependence on IT: Business users handle their own variance analysis.
- Improved data literacy: Users learn the data by navigating it.
- Better strategic decisions: They’re grounded in detail.
The qualitative effect: finance and operations meetings stop being about chasing down numbers and start being about deciding what to do.
What Challenges Exist with Drill Down Analysis?
Three challenges show up at scale:
- Performance: Drilling from a summary to millions of detail rows can be slow if the data model and indexes aren’t tuned.
- Data model complexity: Multi-source data, where hierarchies live across ERP, HR, CRM, and supply chain systems, needs a unified semantic layer.
- Security: A controller drilling from a consolidated GL view should not be able to reach a subledger they’re not authorized to see.
The fixes: pre-aggregated levels to keep summary queries fast, a unified semantic layer that resolves hierarchies across ERP modules, and role-based access control that applies at the row level as the user drills.
What Are Drill Down Analysis Best Practices?
Four habits make drill down implementations sustainable:
- Design clear hierarchies that match how the business thinks, not how the source schema is organized.
- Optimize for performance with pre-aggregation, indexing, and caching.
- Implement role-based access control at the row level.
- Combine drill down with drill through and drill across so users can navigate not just deeper but also sideways into related data.
How Do You Implement Drill Down Analysis?
A realistic rollout has four steps:
- Define the business hierarchies with the people who use them: finance owns GL, HR owns org, sales owns territory.
- Structure the data model around those hierarchies with consistent parent-child mapping and pre-aggregated summary levels.
- Choose a BI tool with pre-built Oracle ERP hierarchies, which saves significant modeling work versus a general-purpose tool.
- Test with real users on real questions before rolling out widely.
Frequently Asked Questions
Q1. What is drill down analysis in simple terms?
Drill down lets you click a summary number and see the detail rows that make it up, then click again to see finer detail. It’s the natural way to investigate why a total looks the way it does without writing a new query or asking an analyst.
Q2. How does drill down differ from drill through?
Drill down moves to a more detailed level within the same hierarchy, year to quarter to month. Drill through jumps to a related report outside the current visualization, clicking a GL balance to open the underlying journal lines. Most BI tools support both.
Q3. What is a hierarchy in drill down analysis?
A hierarchy is the pre-defined navigation path the user follows when drilling. Calendar hierarchies go year-quarter-month-day. GL hierarchies go account group-account-cost center-line. The hierarchy defines what “the next level down” means at each click.
Q4. Can drill down work with Oracle ERP data?
Yes. Mature BI platforms ship with pre-built hierarchies for Oracle Fusion Cloud, EBS, PeopleSoft, and NetSuite, GL chart of accounts, organizational structures, customer and supplier, item master, and calendar, so teams can drill against live ERP data without building hierarchies from scratch.
Q5. How does drill down affect report performance?
Drill down can be fast or slow depending on data model design. Pre-aggregated summary levels, proper indexing, and caching keep the experience responsive even when the underlying detail runs to millions of rows.
Q6. What is the difference between drill down and filtering?
Filtering removes data from the current view based on a condition. Drill down changes the level of aggregation while keeping the same context. They’re complementary: users typically filter to narrow scope, then drill to investigate.
Ready to give your finance and operations teams self-service drill down from Oracle ERP summaries to transaction detail? Request a demo to see how Orbit Analytics delivers pre-built hierarchies and GL-to-subledger drill across Fusion, EBS, and NetSuite.
