
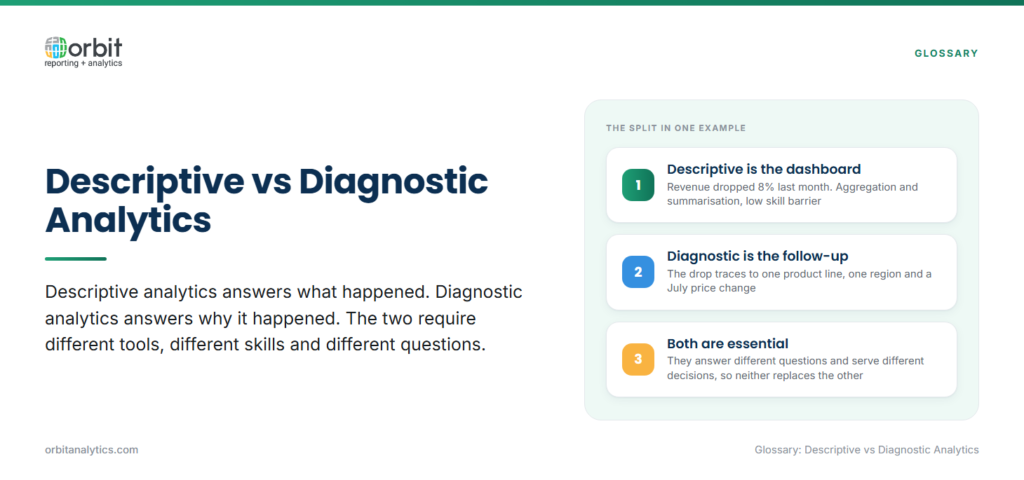
Every analytics conversation eventually splits into two questions: what happened, and why did it happen. The first is descriptive analytics. The second is diagnostic analytics. Understanding descriptive vs diagnostic analytics is the foundation of any serious data strategy, because the two capabilities require different tools, different skills, and different conversations with the business.
A dashboard that shows revenue dropped 8% last month is descriptive. The follow-up analysis that traces the drop to a single product line, a specific region, and a price-change event is diagnostic. Both are essential, but they answer different questions and serve different decisions.
This guide compares the two, shows how they fit into the broader analytics maturity stack, and explains how Oracle ERP teams use them together. It is written for finance, operations, and BI leaders who need to move beyond static reports into real analysis.
Quick overview: descriptive vs diagnostic analytics
| Factor | Descriptive analytics | Diagnostic analytics |
| Question answered | What happened? | Why did it happen? |
| Techniques | Aggregation, summarisation | Drill-down, root cause analysis |
| Complexity | Lower | Higher |
| Outputs | Reports, dashboards, KPIs | Insights, explanations |
| Skills required | Basic data literacy | Analytical reasoning |
| Tools | BI dashboards, Excel | Advanced BI, statistical tools |
| Best for | Monitoring, reporting | Investigation, problem-solving |
What is descriptive analytics?
Descriptive analytics summarises historical data to answer “what happened?” It is the most widely used form of analytics and the foundation every analytics programme starts with.
Key characteristics
- Aggregation-driven: Raw transactions roll up into reports, dashboards, and KPIs (revenue by region, days sales outstanding, inventory turns, expense by cost centre).
- Backward-looking: Output tells you what your business did over the last day, week, quarter, or year.
- Cause-agnostic: It does not explain why something happened and does not project forward.
How descriptive analytics works
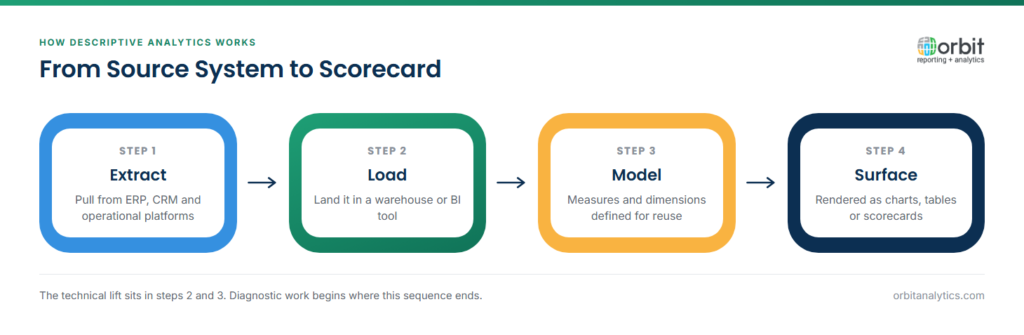
The workflow follows a predictable sequence:
- Extract data from source systems such as ERP, CRM, and operational platforms.
- Load it into a warehouse or BI tool.
- Model the data with measures and dimensions for consistent reuse.
- Surface the result as charts, tables, or scorecards.
The technical lift sits in data preparation and modelling.
Pros and cons of descriptive analytics
| Strengths | Weaknesses |
| Easy to understand, fast to deploy | Tells you what but not why |
| Low skill barrier for end users | Can mislead if data is incomplete |
| Supports daily decision-making | Becomes overwhelming when dashboards multiply |
What is diagnostic analytics?
Diagnostic analytics goes one step deeper to answer “why did it happen?” It uses the same data but applies investigative techniques to surface drivers, correlations, and root causes.
Key characteristics
- Starts where descriptive ends: The dashboard flags a variance; the analyst drills in.
- Crosses dimensions: The investigation pivots across time, region, customer, product, and account to isolate which combination drove the result.
- Uses investigative techniques: Drill-down, slice-and-dice, correlation analysis, and root cause investigation.
- Outputs explanations, not numbers: A finding might read: “Q3 margin compression was driven by a 12-point mix shift toward Product B.”
How diagnostic analytics works
Diagnostic analytics depends on data being granular and connected. The analyst needs to drill from a single KPI down to the underlying transactions and pivot across dimensions without rebuilding the model each time. This is where well-designed semantic layers, ad-hoc query tools, and self-service drill-down pay off. Orbit Analytics provides drill-down from any KPI directly into the underlying Oracle Fusion Cloud or EBS transaction, so users can answer “why” without filing an IT ticket.
Pros and cons of diagnostic analytics
| Strengths | Weaknesses |
| Explains drivers and root causes | Requires analytical reasoning |
| Surfaces hidden patterns | Depends on data quality |
| Supports corrective action | Slower than running a standard report |
Descriptive vs diagnostic analytics: key differences
Purpose: what happened vs why it happened
This is the headline difference. Descriptive answers “what.” Diagnostic answers “why.” Every other distinction flows from this one.
Techniques: summarisation vs root cause analysis
Descriptive analytics uses aggregation, totals, averages, and ratios. Diagnostic analytics uses drill-down, decomposition, correlation, and hypothesis testing.
Outputs: reports vs insights
Descriptive produces standard outputs: a dashboard, a scorecard, a recurring report. Diagnostic produces narrative insights: a one-page explanation of what drove the variance.
Complexity and skill requirements
Descriptive analytics is approachable for any business user. Diagnostic analytics requires comfort with data, statistical thinking, and a willingness to follow the evidence rather than the assumption.
When to choose descriptive analytics
Use descriptive analytics for recurring, repeatable views of the business:
- Performance monitoring across the operating cadence
- KPI dashboards for functional teams
- Executive scorecards at the board or management level
- Regulatory reporting with stable definitions
- Recurring data delivery for partners or business units
Finance teams running monthly close, operations leads tracking shop-floor metrics, and executives reviewing weekly performance benefit most because they need a reliable, repeatable view.
When to choose diagnostic analytics
Use diagnostic analytics whenever a descriptive report surfaces a variance, an anomaly, or an unexpected result:
- Variance analysis during month-end close
- Customer churn investigations when retention drops
- Margin compression studies when gross margin slips
- Pipeline drop analysis for sales operations
- Supplier defect reviews for supply chain teams
Controllers explaining variances, sales operations diagnosing pipeline drops, and supply chain teams investigating supplier defects benefit most from diagnostic capabilities.
The four types of analytics explained
It helps to place descriptive and diagnostic inside the broader analytics maturity stack:
| Type | Question answered | Techniques |
| Descriptive | What happened? | Reports, dashboards, KPIs |
| Diagnostic | Why did it happen? | Drill-down, correlation, root cause |
| Predictive | What will happen? | Forecasting, machine learning, time-series |
| Prescriptive | What should we do? | Optimisation, recommendation engines |
Each layer builds on the one below. You cannot do credible predictive analytics without solid descriptive and diagnostic foundations.
Using descriptive and diagnostic analytics together
Building an analytics maturity roadmap
Most organisations master descriptive first, then layer diagnostic on top, then progress to predictive and prescriptive. Skipping straight to predictive without a clean diagnostic foundation produces models nobody trusts.
Combining both for complete understanding
In daily operation, descriptive and diagnostic work in pairs. The dashboard flags the variance; the drill-down explains it; the explanation drives the action. A modern augmented analytics platform shortens this loop by surfacing the likely driver of a variance automatically, so analysts spend their time validating the explanation rather than building the query.
Common challenges and how to overcome them
Two challenges trip up most diagnostic programmes:
- Data quality gaps: Diagnostic analytics exposes data issues that descriptive reports hide. When you drill from a summary into the underlying records and the numbers do not tie, the gap shows immediately. The fix is upstream: clean reference data, validated joins, and a single source of truth from the ERP.
- Missing drill-down: Many BI deployments stop at the summary view, forcing analysts back to spreadsheets when they need to investigate. The fix is choosing tools that connect the dashboard directly to the underlying transaction, with no export step.
Our recommendation
Build descriptive analytics first: clean KPIs, trusted dashboards, recurring reports. Then add diagnostic capability by enabling drill-down, ad-hoc query, and root cause exploration on the same data model. Orbit Analytics supports both natively for Oracle ERP, with self-service reporting on top of live Fusion Cloud and EBS data so analysts move from “what” to “why” without leaving the platform.
Frequently Asked Questions
Q1. What is the difference between descriptive and diagnostic analytics?
Descriptive analytics summarises historical data to answer “what happened.” Diagnostic analytics investigates that data to answer “why it happened.” Descriptive produces reports and dashboards; diagnostic produces explanations and root cause insights.
Q2. Which comes first, descriptive or diagnostic analytics?
Descriptive comes first. You need a reliable view of what happened before you can investigate why. Most analytics maturity roadmaps build descriptive capability first, then layer diagnostic on top.
Q3. What is an example of descriptive analytics?
A monthly revenue dashboard that shows total revenue by region, by product line, and by customer segment is descriptive analytics. It summarises what happened without explaining why.
Q4. What is an example of diagnostic analytics?
Investigating why Q3 margin dropped, drilling from the margin KPI into product mix, customer pricing, and cost variances to isolate the specific drivers, is diagnostic analytics.
Q5. Can I use descriptive and diagnostic analytics together?
Yes, and the most effective analytics workflows pair them. The descriptive dashboard flags a variance; the diagnostic drill-down explains it. Together they support both monitoring and decision-making.
Q6. Is a dashboard descriptive or diagnostic analytics?
A standard dashboard is descriptive. It becomes diagnostic only when users can drill from a summary KPI into the underlying transactions, slice the data across dimensions, and trace results back to root causes.
Ready to move from “what happened” to “why it happened” without bouncing between five different tools? Request a demo to see how Orbit Analytics delivers both descriptive and diagnostic analytics on live Oracle ERP data.
