
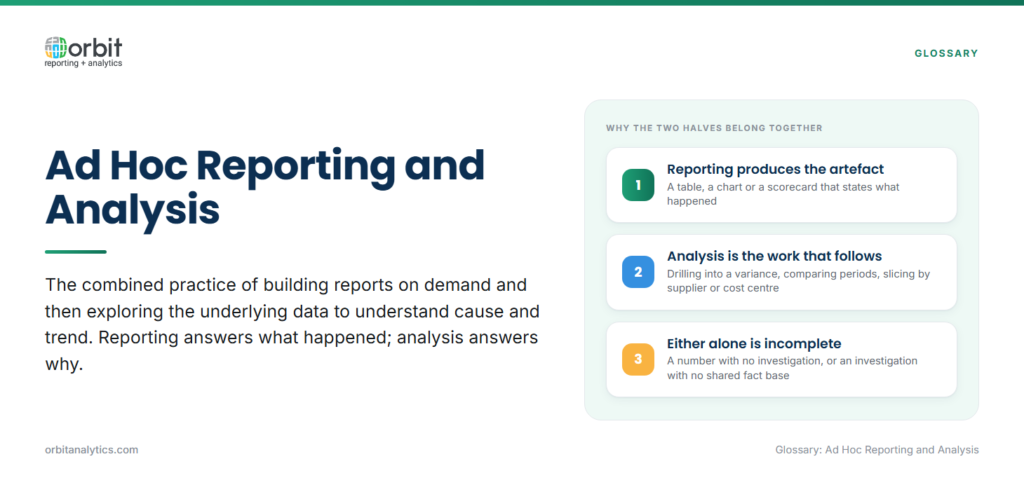
Ad hoc reporting and analysis is the combined practice of building reports on demand and then exploring the underlying data to understand cause and trend. Reporting answers what happened. Analysis answers why it happened and what to do next. Together they replace the static, scheduled report with an interactive session that ends in a decision.
The reporting side produces a structured artefact: a table, a chart, a scorecard. The analysis side is the iterative work that follows: drilling into a variance, comparing periods, slicing by supplier or cost center, testing a hypothesis. Either alone is incomplete.
For business intelligence programmes, the two functions belong on the same platform. When users jump between a reporting tool, a spreadsheet, and an analyst’s notebook, they lose context, introduce errors, and stop trusting the numbers.
Why Organizations Need Ad Hoc Reporting and Analysis
Three gaps in static reporting create the case for ad hoc capability:
- Static dashboards age quickly. The metrics chosen six months ago do not always cover today’s question, and dashboards rarely allow drill-down beyond two or three fixed dimensions.
- Anomalies need investigation, not just observation. A 12% jump in days-payable-outstanding might be a single late supplier or a systemic process change; the dashboard cannot tell the difference. Ad hoc analysis lets the user pivot, filter, and drill until the root cause surfaces.
- Decision speed follows data speed. When a regional VP can answer their own variance question in fifteen minutes, the decision cycle compresses from a week to an afternoon.
Key Capabilities of Ad Hoc Reporting and Analysis Tools
A capable platform supports the full investigative loop:
- Flexible query building without code. Business users assemble columns, filters, and joins through a guided interface rather than writing SQL against the GL schema.
- Drill-down and drill-through. Click a margin number to see the contributing accounts; click an account to see the contributing transactions.
- Visualization on the fly. Switch between table, bar, line, and pivot without re-running the underlying query.
- Collaboration. Share the analysis with a comment, schedule it as a recurring report, or hand it to an analyst with full lineage.
Orbit Analytics provides drill-down and drill-through directly against Oracle Fusion Cloud and EBS data, so a manager can move from a P&L line to the source journal entry without leaving the report. The semantic layer is pre-built against the Oracle schema, which removes most of the modelling work that delays projects on generic BI tools.
Benefits of Combining Reporting with Analysis
Putting reporting and analysis on one surface delivers four practical gains:
- Answer the what and the why together. Reports describe; analysis explains. Users stop bouncing between tools.
- Root-cause investigation becomes routine. A variance flagged in Monday’s report is investigated in the same session, not deferred to a separate review.
- Operational and strategic decisions share a fact base. The same numbers behind the executive dashboard back the supervisor’s daily cycle count, eliminating the “your number versus my number” argument.
- Time from question to insight shrinks. Minutes instead of days. That is the single most-cited reason finance teams move off legacy reporting tools.
Challenges in Ad Hoc Reporting and Analysis
The benefits do not come automatically. Three challenges show up consistently:
- Data quality and trust. If two users get different answers to the same question, adoption collapses. The fix is a certified semantic layer where definitions for revenue, margin, and headcount are governed centrally.
- Analysis paralysis. Too many dimensions and no starting point can leave users stuck. Pre-built analysis templates for variance, ageing, and cycle-time give people a defensible launch pad.
- Self-service versus governance. Free-for-all access creates risk. Role-based access, certified datasets, and audit logs let IT open the platform to business users without losing control.
Ad Hoc Reporting and Analysis Use Cases
The same investigative pattern surfaces across functions, but the analysis paths differ:
| Function | Trigger | Typical Ad Hoc Path |
| Finance | Variance flag on actuals vs budget | Roll up chart of accounts at any level; build rolling 13-month liquidity views on demand |
| Supply chain | Stock-out alert | Investigate demand patterns by product family, region, and lead-time bucket |
| Sales | Pipeline slip | Compare win rate by stage, rep, and deal size to find where deals slow down |
| Operations | Yield drop | Walk from production yield, to work-order delays, to specific machines or shifts |
Best Practices for Effective Ad Hoc Analysis
Effective analysis is disciplined, not freeform. Four practices help:
- Start with a clear hypothesis. “Margin dropped because of mix” is testable; “something looks off” is not.
- Use consistent definitions. Tie every report back to the governed semantic layer so two analyses of the same metric agree.
- Document the steps. A short note on filters, joins, and assumptions makes the analysis defensible six months later.
- Share with context. A chart without commentary is a Rorschach test; a chart with a one-paragraph finding drives a decision.
How to Get Started with Ad Hoc Reporting and Analysis
Work through four steps in order:
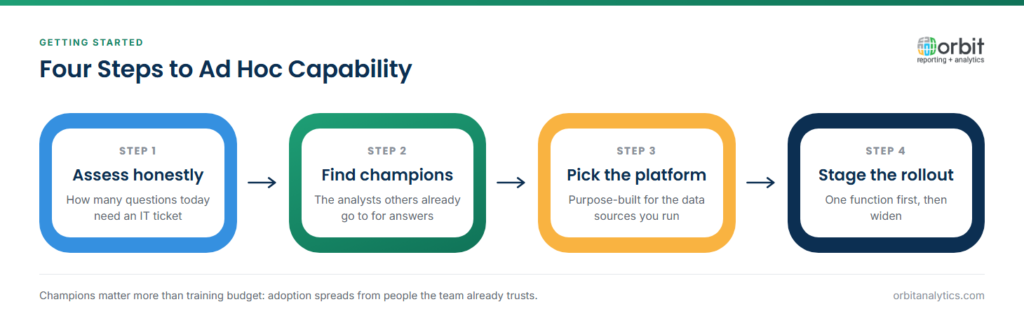
- Assess current capability honestly. How many ad hoc requests does IT field per month? How long does each take? Where are users exporting to Excel because the BI tool will not let them pivot?
- Identify analysis champions. Find two or three people in finance and operations who already build their own pivots. They become the first wave of trained users and the internal advocates for governed self-service.
- Select a platform purpose-built for your data sources. For Oracle ERP shops, that means pre-built connectors, a curated semantic layer over Fusion and EBS, and operational reporting capabilities that handle real-time queries against transactional data. Orbit Analytics ships with 1,000+ pre-built reports and a governed metric layer for Oracle, so the platform delivers both certified reports and investigative analysis from day one. Pair that with a starter library of common analyses, such as P&L variance, AR ageing, and supplier scorecards, and adoption follows.
- Run a staged rollout. Pilot with one function, publish ten certified reports, train the champions, and only then open the platform to broader self-service.
Frequently Asked Questions
Q1. What is the difference between ad hoc reporting and ad hoc analysis?
Ad hoc reporting produces a structured output, such as a table or chart, in response to a one-off question. Ad hoc analysis is the iterative exploration that follows, where users drill, filter, and pivot to understand the cause behind a number. Most modern platforms combine the two into a single workflow.
Q2. Who should have access to ad hoc analysis capabilities?
Function leads, controllers, financial analysts, ops managers, and senior business users typically benefit most. Access should be governed by role-based controls so users see only the data they are entitled to and pull from certified datasets rather than raw tables.
Q3. How do you ensure data accuracy in ad hoc analysis?
Anchor every analysis in a certified semantic layer where business metrics are defined once and reused. Combine that with data lineage so users can trace any number back to its source, and with audit logging so unusual queries are visible to data stewards.
Q4. How does ad hoc analysis fit into enterprise BI?
It sits alongside scheduled reports and executive dashboards as the investigative layer of the BI stack. Dashboards monitor; ad hoc analysis explains. A complete enterprise BI program needs both, plus the governed business intelligence layer that ties them together.
Q5. Can ad hoc analysis be automated?
Recurring analyses can be saved as scheduled reports or alerts, but the value of ad hoc work is in answering novel questions. Treat automation as a graduation path: once a question is asked three times, productize it as a standing report and free the analyst to investigate the next anomaly.
Q6. What data sources work with ad hoc analysis tools?
The best platforms connect to Oracle Fusion Cloud, EBS, NetSuite, PeopleSoft, and major cloud warehouses, with pre-built models for common modules. Pre-built connectors matter because they let analysts blend ERP, HCM, and external data without building integrations from scratch.
Ready to combine on-demand reporting with deep investigation across your Oracle ERP data? Request a demo to see how Orbit Analytics delivers governed ad hoc reporting and analysis to finance, operations, and supply-chain teams.
