
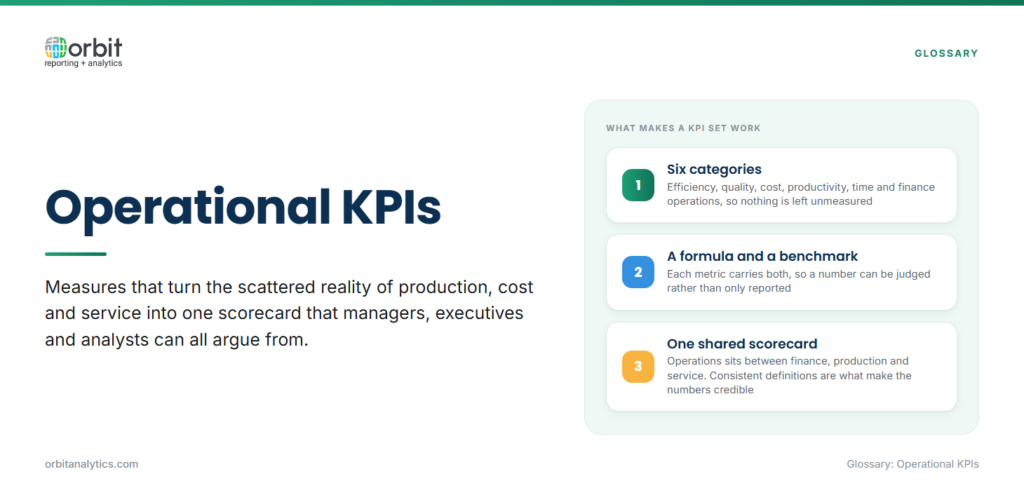
Operations leaders sit at the intersection of finance, production, and customer service. Their daily questions, Are we on schedule? Are costs holding?, only have credible answers when the underlying numbers are consistent. The right operational KPIs turn that scattered reality into one scorecard that managers, executives, and analysts all argue from.
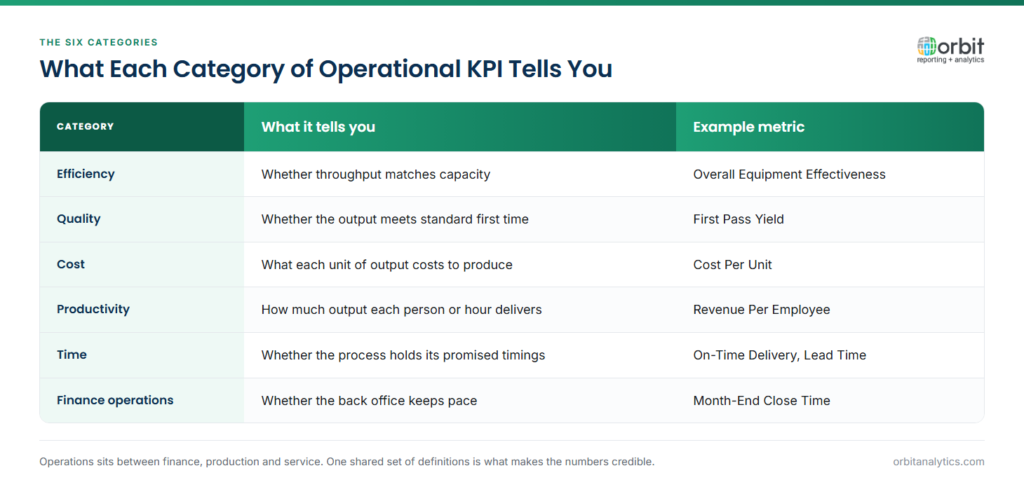
This guide lists 35 KPIs organized by category: efficiency, quality, cost, productivity, time, and finance operations. Each entry includes the formula, a working benchmark, and a one-line reason it matters.
Why Do Operational KPIs Matter?
Operational KPIs measure day-to-day performance. Strategic KPIs measure long-term outcomes. Without the operational layer, leaders see results months after behavior moved and improvement stays anecdotal. With operational KPIs in place, problems surface within the cycle they occur in, and tier meetings become decisions instead of status reads.
Quick Reference: Top Operational KPIs by Category
| Category | KPI | Formula or Definition | Benchmark |
| Efficiency | Cycle Time | Total Time / Units Produced | Track trend |
| Efficiency | OEE | Availability x Performance x Quality | 85%+ world-class |
| Efficiency | Throughput Rate | Units per time period | Track trend |
| Quality | Defect Rate | Defective / Total Units x 100 | <1% |
| Quality | First Pass Yield | Good Units / Total Started x 100 | 95%+ |
| Cost | Cost Per Unit | Total Cost / Units Produced | Track trend |
| Cost | Operating Expense Ratio | OpEx / Revenue x 100 | Industry-specific |
| Productivity | Revenue Per Employee | Revenue / Headcount | Industry-specific |
| Productivity | Utilization Rate | Billable / Available Hours x 100 | 75-85% (services) |
| Time | On-Time Delivery | On-Time Orders / Total x 100 | 98%+ |
| Time | Lead Time | Order to delivery duration | Track trend |
| Finance | Month-End Close Time | Days from period end | 5-7 days |
Efficiency KPIs
- 1. Cycle Time: Total Time / Units Produced. Benchmark: track trend. The headline speed metric for any process.
- 2. Throughput Rate: Units produced per time period. Benchmark: varies. Volume number every operations review opens with.
- 3. Capacity Utilization: (Actual / Maximum Possible Output) x 100. Benchmark: 80-90%. Identifies underused assets and expansion needs.
- 4. First Pass Yield: (Good Units / Total Started) x 100. Benchmark: 95%+. Process capability before rework masks the issue.
- 5. Overall Equipment Effectiveness (OEE): Availability x Performance x Quality. Benchmark: 85%+ world-class. Composite measure of equipment productivity.
- 6. Process Efficiency Ratio: Value-Added Time / Total Cycle Time x 100. Benchmark: higher is better. Exposes how much of a process is waste.
Quality KPIs
- 7. Defect Rate: (Defective / Total Produced) x 100. Benchmark: <1%. Direct measure of product or service quality.
- 8. Error Rate: Mistakes per transaction or process step. Benchmark: <1%. Quality measure for transactional and service work.
- 9. Customer Complaint Rate: Complaints / Orders Shipped x 100. Benchmark: <1%. External quality signal.
- 10. Rework Percentage: (Reworked Units / Total Units) x 100. Benchmark: <5%. Hidden cost of poor quality.
- 11. Quality Score: Composite weighted quality measurement. Benchmark: defined per program. Single number for executive scorecards.
- 12. Return Rate: (Returned / Sold) x 100. Benchmark: <1%. Quality escapes that reach the customer.
Cost KPIs
- 13. Cost Per Unit: Total Cost / Units Produced. Benchmark: track trend. Core profitability driver per SKU or service.
- 14. Operating Expense Ratio: (Operating Expenses / Revenue) x 100. Benchmark: industry-specific. Cost discipline metric.
- 15. Cost Variance: Actual minus Budgeted Cost. Benchmark: +/- 5%. Planning accuracy and control effectiveness.
- 16. Overhead Rate: (Indirect Costs / Direct Costs) x 100. Benchmark: industry-specific. Indirect cost burden tracker.
- 17. Labor Cost Per Unit: Total Labor Cost / Units Produced. Benchmark: track trend vs automation ROI. Workforce productivity measure.
- 18. Material Cost Variance: Actual minus Standard Material Cost. Benchmark: +/- 3%. Procurement effectiveness and standard cost accuracy.
Productivity KPIs
- 19. Revenue Per Employee: Total Revenue / Headcount. Benchmark: industry-specific. Workforce productivity headline.
- 20. Output Per Labor Hour: Units Produced / Work Hours. Benchmark: track trend. Labor productivity at the floor level.
- 21. Task Completion Rate: (Tasks Done On Schedule / Total Tasks) x 100. Benchmark: 90%+. Project and operations execution quality.
- 22. Utilization Rate: (Billable Hours / Available Hours) x 100. Benchmark: 75-85% for services. Resource efficiency metric.
- 23. Employee Productivity Index: Composite output measure per FTE. Benchmark: program-specific. Single productivity number for executives.
- 24. Value Added Per Employee: Gross Profit / Headcount. Benchmark: industry-specific. Margin-aware productivity measure.
Time-Based KPIs
- 25. Lead Time: Order receipt to delivery. Benchmark: track trend. Customer-facing speed metric.
- 26. Processing Time: Active work duration on a unit. Benchmark: track trend. Pure work content of the process.
- 27. Wait Time: Idle time in process. Benchmark: minimize. Where most cycle-time reduction comes from.
- 28. On-Time Delivery Rate: (On-Time Orders / Total Orders) x 100. Benchmark: 98%+. The customer-facing reliability score.
- 29. Takt Time: Available Time / Customer Demand. Benchmark: matches cycle time. Pace the line must hit.
- 30. Downtime Percentage: (Downtime / Scheduled Time) x 100. Benchmark: <10% planned, minimize unplanned. Reliability indicator.
Finance Operations KPIs
- 31. Invoice Processing Time: Receipt to payment duration. Benchmark: <5 days automated. AP efficiency.
- 32. Days Sales Outstanding (DSO): (AR / Credit Sales) x Days. Benchmark: 30-45 days. Collection effectiveness and cash flow.
- 33. Accounts Payable Turnover: Supplier Purchases / Avg AP. Benchmark: 6-12x annually. Payment cycle rhythm.
- 34. Month-End Close Time: Days from period end to close. Benchmark: 5-7 days, 3-4 days top quartile. Finance team efficiency.
- 35. Reconciliation Accuracy: (Matched Items / Total Items) x 100. Benchmark: 99%+. Data quality and audit readiness.
How Do You Choose the Right Operational KPIs?
Pick KPIs that drive decisions, not vanity numbers. Align them with two or three business objectives the executive team has committed to, service level, margin, or growth, then choose metrics that lead to those outcomes. Cap the executive scorecard at five to seven core KPIs; everything else lives on functional dashboards. Orbit Analytics joins Oracle ERP data with operations systems through Oracle Fusion Cloud reporting so cycle time, cost per unit, and DSO sit on one platform instead of three.
What Are Best Practices for KPI Tracking?
Automate data collection so refresh cycles do not depend on one analyst’s calendar. Review KPIs at a regular cadence, daily for shop-floor metrics, weekly for finance ops, monthly for outcomes. Set thresholds and alerts so red metrics trigger action without waiting for a meeting. Orbit Analytics provides business intelligence dashboards with pre-built connectors for Oracle Fusion Cloud and EBS so KPIs refresh from live data. Pair that with operational reporting for transaction-level drill-downs.
Frequently Asked Questions
Q1. What are operational KPIs in simple terms?
Operational KPIs are metrics that measure day-to-day execution, how fast you produce, how accurate you ship, how cheaply you process. They are the numbers that change inside a single shift or week and that operations teams can act on directly.
Q2. What is the difference between operational and strategic KPIs?
Operational KPIs measure short-cycle execution like cycle time or on-time delivery. Strategic KPIs measure long-cycle outcomes like market share or customer lifetime value. Operational metrics feed strategic ones over time.
Q3. How many operational KPIs should a company track?
Five to seven core KPIs at the executive scorecard, plus deeper functional metrics on operational dashboards. Tracking too many headline numbers splits attention and slows decisions.
Q4. How often should operational KPIs be reviewed?
Shop-floor metrics like throughput and defect rate are reviewed daily in tier meetings. Finance ops metrics fit a weekly cadence. Outcome metrics like revenue per employee fit a monthly review.
Q5. What is the difference between KPIs and metrics?
Every KPI is a metric, but not every metric is a KPI. KPIs are the small set of metrics tied to specific business goals that drive decisions. The rest are reference data for analysis and root-cause work.
Q6. What are leading vs lagging operational KPIs?
Leading KPIs predict future outcomes, near-miss reports, MTBF, schedule attainment. Lagging KPIs report what already happened, customer returns, lost-time incidents, monthly variance. Healthy scorecards mix both.
Ready to track these operational KPIs across your Oracle ERP and operations data? Request a demo to see how Orbit Analytics delivers unified dashboards for Oracle Fusion Cloud, EBS, and connected operations systems.
