
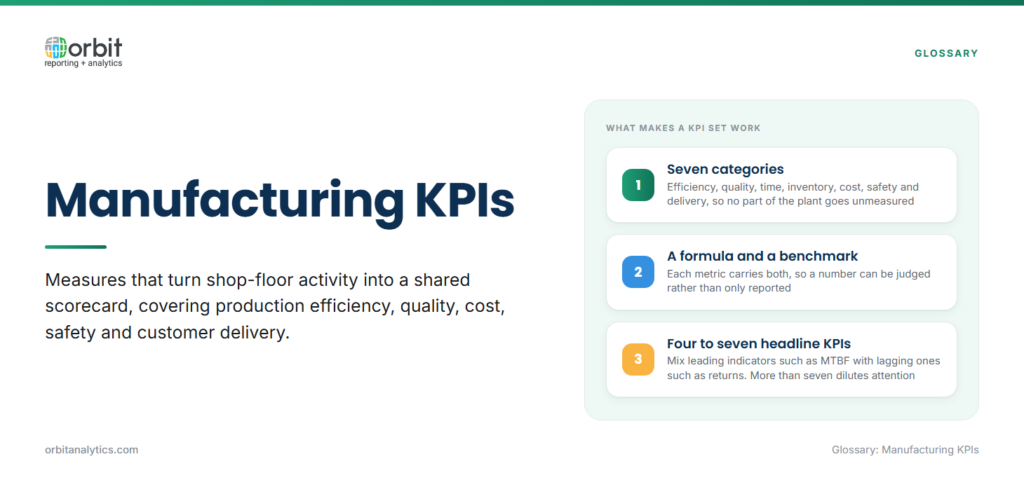
Plant managers operate in a measurement-heavy environment. Equipment hours, yield rates, scrap percentages, incident logs, and shipment dates all compete for attention. The right manufacturing KPIs cut through that noise by giving leadership a shared scorecard across production efficiency, quality, cost, safety, and customer delivery.
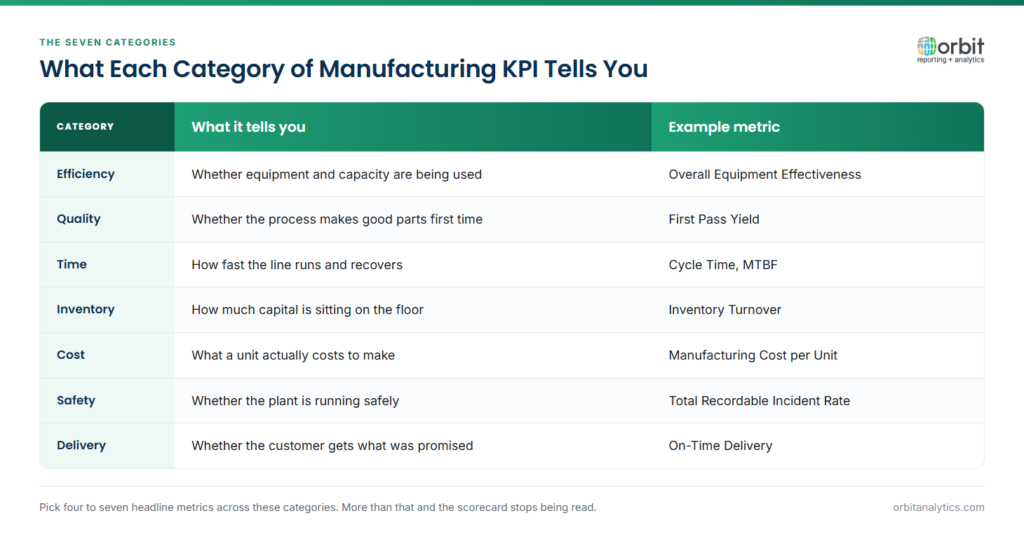
This guide covers 35 KPIs grouped into seven categories. For each metric you get the formula, a working benchmark, and a one-line reason it matters.
Why Do Manufacturing KPIs Matter?
Manufacturing KPIs translate shop-floor activity into decisions that compound over time. They expose underused capacity, quality escapes, and unreliable suppliers before those problems hit the P&L. When the same KPIs feed daily tier meetings, monthly reviews, and executive scorecards, every layer argues from the same numbers.
Quick Reference: Top Manufacturing KPIs at a Glance
| Category | KPI | Formula or Definition | Benchmark |
| Efficiency | Overall Equipment Effectiveness (OEE) | Availability x Performance x Quality | 85%+ world-class |
| Efficiency | Capacity Utilization | Actual / Maximum Output x 100 | 80-90% |
| Quality | First Pass Yield | Good Units / Total Started x 100 | 95%+ |
| Quality | Scrap Rate | Scrap Cost / Total Material Cost x 100 | <2% |
| Time | Cycle Time | Production Time / Units Produced | Track trend |
| Time | MTBF | Operating Time / Failures | Higher is better |
| Inventory | Inventory Turnover | COGS / Average Inventory | 4-6x annually |
| Cost | Manufacturing Cost per Unit | Total Cost / Units Produced | Track trend |
| Safety | TRIR | (Incidents x 200, 000) / Hours Worked | <1.0 |
| Delivery | On-Time Delivery | On-Time / Total Orders x 100 | 98%+ |
Production Efficiency KPIs
- 1. Overall Equipment Effectiveness (OEE): Availability x Performance x Quality. Benchmark: 85%+ world-class; 60% typical. Single composite measure of equipment productivity.
- 2. Capacity Utilization: (Actual Output / Maximum Possible) x 100. Benchmark: 80-90%. Signals underused lines and capital expansion needs.
- 3. Throughput: Units produced per time period. Benchmark: varies. The headline volume number for every operations review.
- 4. Production Attainment: (Actual / Scheduled Production) x 100. Benchmark: 95%+. Tests whether the plan is realistic and execution holds.
- 5. Asset Utilization Rate: (Actual Run Time / Scheduled Run Time) x 100. Benchmark: 85%+. Separates idle assets from busy ones.
Quality KPIs
- 6. First Pass Yield (FPY): (Good Units / Total Started) x 100. Benchmark: 95%+. Measures process capability before rework masks the issue.
- 7. Defect Rate: (Defective / Total Produced) x 100. Benchmark: <1%. Cleanest direct read on product quality.
- 8. Scrap Rate: (Scrap Material Cost / Total Material Cost) x 100. Benchmark: <2%. Waste shows up as both quality and margin problem.
- 9. Rework Rate: (Reworked / Total Produced) x 100. Benchmark: <5%. Hidden cost rarely on the standard cost sheet.
- 10. Customer Return Rate: (Returned / Shipped) x 100. Benchmark: <1%. Tracks quality escapes that reach the customer.
- 11. Right First Time (RFT): (Correct First Time / Total Units) x 100. Benchmark: 95%+. Combines quality and efficiency in one line.
Time-Based KPIs
- 12. Cycle Time: Total Production Time / Units Produced. Benchmark: track trend. Direct measure of production speed.
- 13. Takt Time: Available Time / Customer Demand. Benchmark: matches or slightly exceeds cycle time. The pace your line must hit.
- 14. Manufacturing Lead Time: Order receipt to product completion. Benchmark: industry-specific. The customer-facing speed metric.
- 15. Changeover Time: Last good part of Run A to first good part of Run B. Benchmark: single-digit minutes (SMED). Drives product-mix flexibility.
- 16. Mean Time Between Failures (MTBF): Operating Time / Failures. Benchmark: higher is better. Reliability indicator driving PM plans.
- 17. Mean Time to Repair (MTTR): Repair Time / Repairs. Benchmark: lower is better. How fast maintenance restores production.
Inventory KPIs
- 18. Inventory Turnover: COGS / Average Inventory Value. Benchmark: 4-6x annually. Capital efficiency and cash flow.
- 19. Days of Inventory (DOI): (Average Inventory / COGS) x 365. Benchmark: lower is better. Cash tied up on the floor.
- 20. WIP Turnover: COGS / Average WIP. Benchmark: higher is better. Production flow efficiency between operations.
- 21. Raw Material Inventory Accuracy: (Accurate / Total Counts) x 100. Benchmark: 99%+. Planning is only as good as the BoM data.
- 22. Finished Goods Inventory Levels: Days/weeks of supply on hand. Benchmark: balance vs service-level targets.
Cost KPIs
- 23. Manufacturing Cost per Unit: Total Manufacturing Costs / Units Produced. Benchmark: track trend. Core profitability driver per SKU.
- 24. Maintenance Cost as % of RAV: (Annual Maintenance Cost / Replacement Asset Value) x 100. Benchmark: 2-3%. Tells you if asset management is efficient or starved.
- 25. Cost of Quality (CoQ): Prevention + Appraisal + Failure Costs. Benchmark: <5% of revenue. True price of getting it wrong.
- 26. Energy Cost per Unit: Total Energy Cost / Units Produced. Benchmark: track trend. Operating cost and sustainability in one.
- 27. Labor Cost per Unit: Total Labor Cost / Units Produced. Benchmark: track trend vs automation ROI.
Safety and Compliance KPIs
- 28. Total Recordable Incident Rate (TRIR): (Recordable Incidents x 200, 000) / Hours Worked. Benchmark: <1.0. OSHA-aligned safety scorecard line.
- 29. Lost Time Incident Rate (LTIR): (Lost Time Incidents x 200, 000) / Hours Worked. Benchmark: <0.5. Severity-weighted safety performance.
- 30. Near Miss Frequency Rate: (Near Misses x 200, 000) / Hours Worked. Benchmark: higher reporting is healthier. Leading indicator of safety culture.
- 31. Safety Training Completion Rate: (Trained / Total Employees) x 100. Benchmark: 100%. Keeps risk exposure in check.
- 32. Regulatory Compliance Rate: (Compliant / Total Audits) x 100. Benchmark: 100%. Avoids fines and shutdowns.
Delivery and Customer KPIs
- 33. On-Time Delivery (OTD): (On-Time Orders / Total Orders) x 100. Benchmark: 98%+. The customer-facing reliability score.
- 34. Order Fulfillment Rate: (Complete Orders / Total Orders) x 100. Benchmark: 98%+. Tests whether you ship the full order.
- 35. Perfect Order Rate: (On Time + Complete + Damage-Free + Correctly Invoiced) / Total Orders. Benchmark: 95%+. Captures the full customer experience.
How Do You Choose the Right Manufacturing KPIs?
Start from strategy. A discrete electronics line obsessed with mix flexibility will weight changeover time and FPY differently than a continuous process plant chasing OEE. Pick four to seven core KPIs that mix leading indicators (near misses, MTBF) with lagging ones (returns, cost per unit). Orbit Analytics joins MES production data with cost and inventory data from Oracle EBS reporting or Fusion Cloud so plant and finance argue from the same numbers.
What Are Best Practices for Manufacturing KPI Tracking?
Automate data collection from shop-floor systems first; manual spreadsheets corrode trust as soon as one site goes off-cycle. Display KPIs on visual boards near the line, review them in daily tier meetings, and tie each red metric to a countermeasure with an owner. Orbit Analytics provides business intelligence for manufacturing with pre-built connectors for Oracle Fusion Cloud and EBS, so OEE, scrap, and on-time delivery refresh from source data. Pair that with self-service reporting so plant leads can slice by line, shift, or product without filing IT tickets.
Frequently Asked Questions
Q1. What is the most important KPI in manufacturing?
Overall Equipment Effectiveness (OEE) is the most widely cited because it captures availability, performance, and quality in one number. Most plants pair OEE with on-time delivery and a quality metric like first pass yield.
Q2. How do you calculate OEE?
OEE is Availability x Performance x Quality, each as a decimal. Availability is run time over planned production time. Performance is actual count over ideal-cycle-time output. Quality is good units over total units produced.
Q3. What is a good OEE score for manufacturing?
60% OEE is typical for discrete manufacturing; 85%+ is world-class. Below 40% usually points to systemic issues with planning, maintenance, or quality.
Q4. How many KPIs should a manufacturing plant track?
Four to seven core KPIs for the leadership scorecard, with deeper category metrics on dashboards. Tracking too many top-line KPIs dilutes attention.
Q5. What is the difference between cycle time and takt time?
Cycle time is how long it takes to produce one unit. Takt time is the pace required to meet demand, available production time divided by demand. When cycle time exceeds takt, the line cannot keep up.
Ready to put these manufacturing KPIs to work against your Oracle ERP data? Request a demo to see how Orbit Analytics delivers plant-level dashboards with live data from Oracle Fusion Cloud, EBS, and shop-floor systems.
